Geography IA: Fieldwork Ideas and Data Collection Methods
Are you an IB Geography student embarking on your Internal Assessment (IA) and feeling overwhelmed by the prospect of fieldwork and data collection? You're not alone! This comprehensive guide is designed to provide you with a wealth of Geography IA fieldwork ideas, proven data collection methods, and expert tips to help you craft a successful and compelling IA. We'll cover everything from brainstorming suitable topics to analyzing your findings and writing a stellar report. This guide will equip you with the knowledge and confidence to excel in your IB Geography IA and potentially achieve that coveted 7.
Introduction (Answer the Query Immediately)
The IB Geography Internal Assessment (IA) is a crucial component of your overall IB score, representing 25% of your final grade. A significant part of the IA involves conducting fieldwork and collecting relevant data to support your research question). Choosing the right fieldwork topic and employing effective data collection methods are paramount to achieving a high score. This guide provides a comprehensive overview of potential fieldwork ideas, data collection techniques, and essential tips to help you navigate the IA process successfully. We’ll explore different approaches, from human geography to physical geography, ensuring you have the resources needed to develop a robust and insightful IA.
Struggling with IB Assessments?
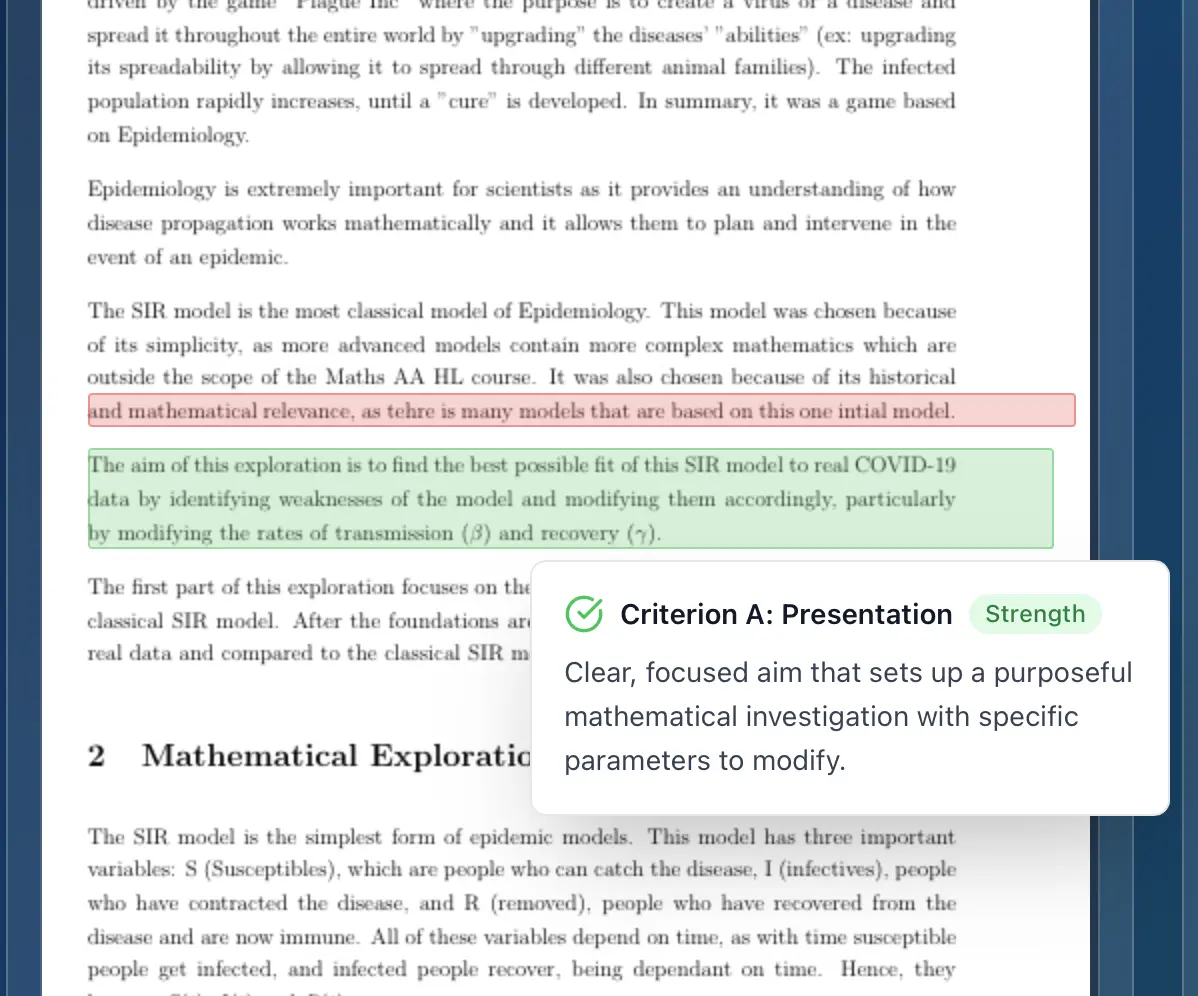
Get instant, detailed feedback on your work with AI that understands IB criteria.
Core Content Sections
Brainstorming Geography IA Fieldwork Ideas
Choosing the right fieldwork topic is the first and arguably most crucial step in your IA journey. The topic should be:
- Relevant: Directly related to the IB Geography syllabus.
- Manageable: Feasible to investigate within the time and resource constraints.
- Interesting: Something you are genuinely passionate about, as this will fuel your motivation.
- Researchable: Data should be accessible and obtainable within your chosen location.
Here are some potential fieldwork ideas, categorized by sub-discipline:
Human Geography:
- Urban Microclimates: Investigate temperature variations in different urban environments (e.g., parks vs. concrete areas) and their impact on human comfort.
- Data Collection: Temperature sensors, surveys on perceived comfort levels.
- Tourism Impacts: Assess the social, economic, or environmental impacts of tourism in a specific location.
- Data Collection: Tourist surveys, interviews with local businesses, environmental quality assessments.
- Retail Geography: Analyze the spatial distribution of retail outlets in a town or city and its relationship to demographics.
- Data Collection: Store counts, customer surveys, demographic data from census reports.
- Urban Sprawl: Investigate the patterns and impacts of urban sprawl on surrounding rural areas.
- Data Collection: Land use maps, satellite imagery analysis, interviews with residents.
- Accessibility and Inequality: Examine the accessibility of essential services (e.g., healthcare, education) for different socio-economic groups in a specific area.
- Data Collection: GIS mapping, accessibility audits, interviews with residents.
Physical Geography:
- River Channel Characteristics: Investigate how river channel characteristics (e.g., width, depth, velocity) change downstream.
- Data Collection: River measurements using flow meters, measuring tapes, and ranging poles.
- Coastal Erosion: Assess the rate and causes of coastal erosion in a specific location.
- Data Collection: Beach profile surveys, sediment analysis, wave measurements.
- Soil Properties: Analyze the variations in soil properties (e.g., pH, texture, organic matter) across a transect.
- Data Collection: Soil samples, pH meters, soil texture analysis.
- Vegetation Patterns: Investigate the relationship between vegetation patterns and environmental factors (e.g., altitude, aspect, soil type).
- Data Collection: Quadrat sampling, species identification, environmental measurements.
- Microplastic Pollution: Assess the distribution and abundance of microplastics in a local river or beach.
- Data Collection: Water and sediment samples, microscope analysis, density separation.
Example:
Let's say you're interested in urban microclimates. You could formulate a research question like: "To what extent does vegetation cover influence air temperature in different urban environments in [Your City]?"
Choosing the Right Data Collection Methods
Once you have your fieldwork idea, you need to select appropriate data collection methods. Consider the following:
- Quantitative Data: Numerical data that can be statistically analyzed (e.g., temperature readings, river flow measurements).
- Qualitative Data: Descriptive data that provides insights into opinions, experiences, and perspectives (e.g., interview transcripts, field observations).
- Primary Data: Data collected directly by you during fieldwork.
- Secondary Data: Data collected by others (e.g., government statistics, academic research papers).
Here's a breakdown of common data collection methods:
- Surveys: Collect data from a large sample of people using questionnaires.
- Types: Online surveys, paper-based surveys, face-to-face interviews.
- Tips: Design clear and concise questions, pilot test your survey, ensure anonymity.
- Interviews: Gather in-depth information from individuals or groups through structured or semi-structured conversations.
- Types: Structured interviews (pre-defined questions), semi-structured interviews (flexible questions).
- Tips: Prepare a list of questions, obtain informed consent, record the interview (with permission).
- Observations: Record observations of phenomena in the field.
- Types: Participant observation (actively involved), non-participant observation (observing from a distance).
- Tips: Use a standardized observation checklist, record detailed notes, minimize bias.
- Measurements: Collect quantitative data using instruments and tools.
- Examples: Temperature sensors, flow meters, pH meters, GPS devices.
- Tips: Calibrate your instruments, take multiple measurements, record units of measurement.
- Mapping: Create maps to visualize spatial patterns and relationships.
- Types: Sketch maps, thematic maps, GIS maps.
- Tips: Use appropriate symbols and legends, ensure accurate scale and orientation.
- Photography and Videography: Capture visual evidence of fieldwork sites and phenomena.
- Tips: Take clear and well-composed photos/videos, label photos/videos with location and date.
- Secondary Data Analysis: Analyze existing data sources to support your research.
- Examples: Census data, government reports, academic papers.
- Tips: Evaluate the reliability and validity of the data source, cite your sources properly.
Example:
For the urban microclimate IA, you could use temperature sensors to collect quantitative data on air temperature at different locations. You could also conduct surveys to gather qualitative data on people's perceived comfort levels in those locations.
Data Presentation and Analysis
Once you've collected your data, you need to present it effectively and analyze it to draw meaningful conclusions.
- Data Presentation: Use tables, graphs, charts, and maps to visually represent your data.
- Tips: Choose appropriate graph types, label axes clearly, provide descriptive captions.
- Data Analysis: Use statistical techniques (e.g., mean, standard deviation, correlation) to analyze quantitative data. Interpret qualitative data by identifying themes and patterns.
- Tips: Use appropriate statistical tests, explain your findings clearly, relate your findings to your research question.
Example:
For the river channel characteristics IA, you could present your data in a table showing the changes in river width, depth, and velocity downstream. You could then create a graph to visualize the relationship between distance downstream and river velocity. You could use statistical analysis to determine if there is a significant correlation between these variables.
Common Challenges/Mistakes Section
Many students face similar challenges when completing their Geography IA. Here are some common mistakes and how to avoid them:
- Poorly Defined Research Question: A vague or overly broad research question will make it difficult to focus your fieldwork and analysis.
- Solution: Refine your research question to be specific, measurable, achievable, relevant, and time-bound (SMART).
- Inadequate Data Collection: Insufficient or unreliable data will weaken your conclusions.
- Solution: Plan your data collection carefully, use appropriate methods, and collect enough data to ensure statistical significance.
- Lack of Critical Analysis: Simply presenting data without analyzing it critically will result in a low score.
- Solution: Interpret your findings in the context of your research question, identify limitations, and suggest areas for further research.
- Poor Presentation: Unclear or poorly organized presentation will make it difficult for the examiner to understand your work.
- Solution: Use clear and concise language, organize your report logically, and use appropriate visuals.
- Plagiarism: Presenting someone else's work as your own is a serious academic offense.
- Solution: Cite all sources properly, use quotation marks for direct quotes, and paraphrase carefully.
Advanced Tips/Strategies Section
To take your IA to the next level, consider these advanced tips:
- Spatial Analysis with GIS: Use Geographic Information Systems (GIS) software to analyze spatial data and create compelling maps.
- Statistical Modeling: Use statistical models to predict future trends or relationships.
- Triangulation: Use multiple data collection methods to validate your findings.
- Reflexivity: Reflect on your own biases and how they might have influenced your research.
- Connect to Real-World Issues: Relate your findings to current events or global challenges.
Pro Tip: Get AI-Powered Grading
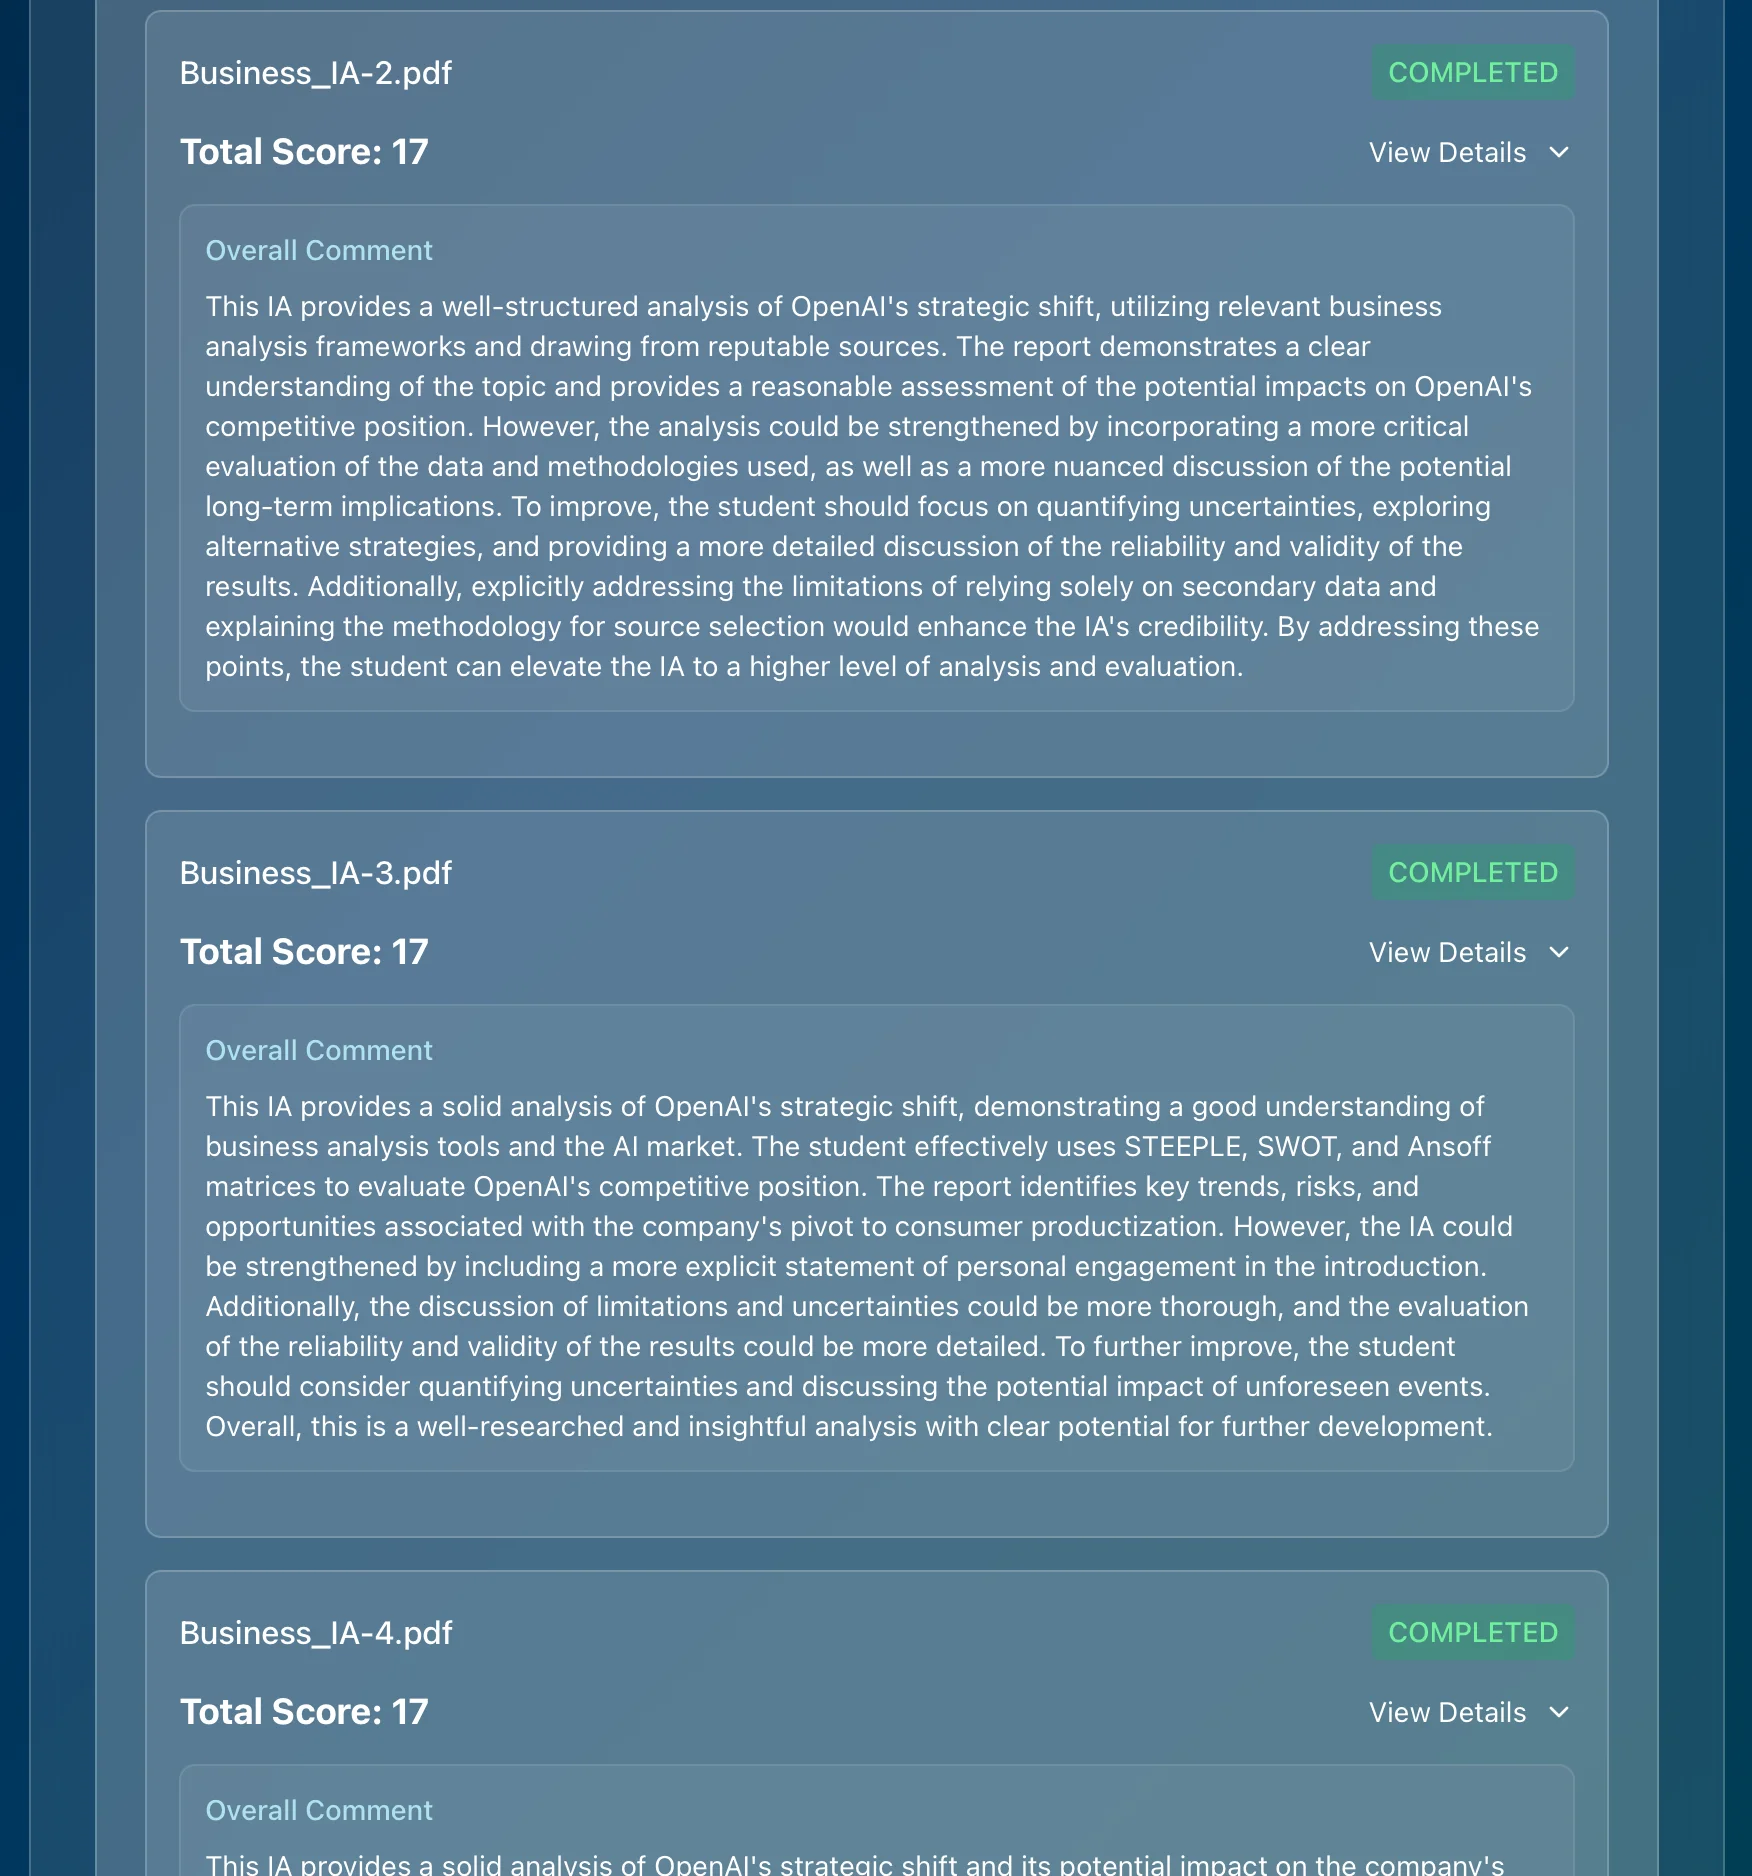
Stop second-guessing your grades. Get instant feedback aligned with official IB rubrics.
Technology and Modern Assessment Section
Technology is playing an increasingly important role in IB Geography assessments. GIS software, remote sensing data, and online survey tools can enhance your fieldwork and analysis. Furthermore, AI is revolutionizing how IAs are graded and how students receive feedback.
As a leading AI grading assistant, Marksy helps teachers provide consistent, detailed feedback on IB Geography IAs. Marksy uses official IB rubrics to ensure accuracy and fairness, providing criterion-by-criterion feedback and suggestions for improvement. This not only saves teachers valuable time but also helps students understand exactly how to improve their work and achieve higher scores. By leveraging AI, educators can maintain assessment quality while streamlining their grading workflow. Marksy helps ensure that feedback is consistent, unbiased, and aligned with the IB's rigorous standards.
Conclusion with Clear Next Steps
Completing your IB Geography IA can be a challenging but rewarding experience. By choosing a relevant fieldwork topic, employing effective data collection methods, and analyzing your findings critically, you can craft a compelling and insightful IA that demonstrates your understanding of geographical concepts and skills. Remember to avoid common mistakes, seek feedback from your teacher, and utilize available resources to support your work.
Next Steps:
- Brainstorm potential fieldwork ideas based on your interests and available resources.
- Refine your research question to be specific, measurable, achievable, relevant, and time-bound.
- Develop a detailed data collection plan that includes appropriate methods and sample sizes.
- Conduct your fieldwork and collect your data carefully.
- Analyze your data and draw meaningful conclusions.
- Write your IA report in a clear and concise manner.
- Seek feedback from your teacher and revise your work accordingly.
Ready to take your IB Geography IA to the next level? Try Marksy for free today and experience the power of AI-driven feedback to improve your score or streamline your grading workflow!