IB Chemistry IA: Mastering Data Analysis and Presentation
Are you aiming for a top score on your IB Chemistry Internal Assessment (IA)? Data analysis and presentation are crucial components that can significantly impact your final grade. This guide provides a comprehensive overview of how to effectively analyze and present your data, ensuring you meet the rigorous standards of the International Baccalaureate (IB) program. We'll break down the key aspects of data processing, uncertainty analysis, graphical representation, and interpretation, equipping you with the knowledge and skills to excel. Whether you're just starting your IA or looking to refine your existing work, this guide will help you master the art of data analysis and presentation in your IB Chemistry IA. Keep the Chemistry IA subject guide nearby while you draft so your analysis maps directly to criteria language.
Introduction (Answer the Query Immediately)
The IB Chemistry Internal Assessment (IA) is a significant component of your overall IB score, and mastering data analysis and presentation is key to achieving a high mark. This guide will walk you through the essential steps, from collecting raw data to drawing meaningful conclusions. We'll cover everything from understanding uncertainties and processing data to creating effective graphs and tables. You'll learn how to interpret your results in the context of your research question) and scientific literature, ensuring your IA demonstrates a thorough understanding of chemistry principles. We will also explore how modern AI grading assistants can help you refine your work and ensure it meets the stringent IB criteria.
Struggling with IB Assessments?
Get instant, detailed feedback on your work with AI that understands IB criteria.
Understanding the Importance of Data Analysis in Your IB Chemistry IA
Data analysis isn't just about crunching numbers; it's about extracting meaningful insights from your experimental results. In the context of your IB Chemistry IA, effective data analysis demonstrates your understanding of the underlying chemical principles and your ability to apply them to real-world investigations. A well-analyzed dataset allows you to draw valid conclusions, support your hypotheses, and ultimately, earn a higher score.
Core Content Sections
1. Data Collection: Laying the Foundation for Success
Before you can analyze your data, you need to collect it accurately and systematically. Here's how:
- Planning is Key: Before starting your experiment, create a detailed data table with clear headings, units, and uncertainty estimates. This will ensure consistency and minimize errors during data collection.
- Replicates Matter: Conduct multiple trials (at least three, ideally five or more) to improve the reliability of your results. More data points lead to more robust statistical analysis.
- Control Variables: Carefully control all variables that could affect your results, except for the independent variable you are investigating. Document these controlled variables in your IA.
- Record Everything: Don't just record the data you expect to be relevant. Note any observations, anomalies, or unexpected events that might influence your interpretation.
2. Data Processing: Transforming Raw Data into Meaningful Information
Data processing involves manipulating your raw data to reveal patterns and trends. Here's a breakdown of common techniques:
- Calculations: Perform necessary calculations, such as calculating averages, concentrations, or reaction rates. Show clear working steps for at least one example of each calculation.
- Uncertainty Analysis: This is crucial! Determine the absolute and percentage uncertainties for each measurement. Propagate uncertainties through your calculations to determine the uncertainty in your final results.
- Example: If you're measuring the volume of a liquid using a burette, the uncertainty is typically half the smallest division on the burette.
- Significant Figures: Use the correct number of significant figures in all your calculations and final results. The number of significant figures should reflect the precision of your measurements.
- Units: Always include units with your data and calculations. Ensure that your units are consistent throughout your IA.
3. Graphical Representation: Visualizing Your Data
Graphs are powerful tools for visualizing trends and relationships in your data. Here's how to create effective graphs for your IB Chemistry IA:
- Choosing the Right Graph: Select the appropriate type of graph for your data. Scatter plots are ideal for showing relationships between two continuous variables, while bar graphs are suitable for comparing discrete categories.
- Clear Labels and Titles: Label your axes clearly with the variable name and units. Give your graph a descriptive title that accurately reflects the data being presented.
- Error Bars: Include error bars on your data points to represent the uncertainty in your measurements. This gives the reader a visual indication of the reliability of your data.
- Line of Best Fit: If appropriate, draw a line of best fit through your data points. The line should represent the overall trend in the data and should not necessarily pass through all the points.
- Software Recommendations: Use spreadsheet software like Microsoft Excel or Google Sheets to create your graphs. These programs offer a variety of graphing options and allow you to easily add error bars and trendlines.
4. Data Interpretation: Drawing Meaningful Conclusions
The final step in data analysis is interpreting your results and drawing meaningful conclusions. Here's how to do it effectively:
- Relate to Research Question: Clearly state whether your data supports or refutes your initial hypothesis. Explain how your results address your research question.
- Discuss Trends and Patterns: Describe any trends or patterns you observe in your data. Explain the underlying chemical principles that might explain these trends.
- Compare to Literature Values: Compare your experimental results to accepted literature values. Discuss any discrepancies and suggest possible reasons for the differences.
- Address Uncertainties: Discuss the impact of uncertainties on your conclusions. Explain how uncertainties might limit the validity of your results.
- Justify Conclusions: Ensure your conclusions are fully supported and justified by your data analysis results.
Common Challenges/Mistakes Section
Many IB Chemistry students struggle with certain aspects of data analysis. Here are some common challenges and how to overcome them:
- Incorrect Uncertainty Propagation: This is a frequent error. Make sure you understand the rules for propagating uncertainties through different types of calculations (addition, subtraction, multiplication, division, powers).
- Solution: Review the uncertainty propagation rules in your textbook or online resources. Practice applying these rules to different types of calculations.
- Inappropriate Graph Selection: Choosing the wrong type of graph can obscure the data and make it difficult to interpret.
- Solution: Consider the type of data you are presenting and choose the graph that best illustrates the relationships between the variables.
- Lack of Error Bars: Omitting error bars makes it difficult to assess the reliability of your data.
- Solution: Always include error bars on your graphs to represent the uncertainty in your measurements.
- Overstating Conclusions: Drawing conclusions that are not fully supported by the data can weaken your IA.
- Solution: Be cautious about making claims that are not directly supported by your results. Acknowledge the limitations of your data and avoid overgeneralizing.
- Ignoring Systematic Errors: Failing to identify and address systematic errors can lead to inaccurate conclusions.
- Solution: Carefully consider potential sources of systematic error in your experiment and discuss their impact on your results.
Pro Tip: Get AI-Powered Grading
Stop second-guessing your grades. Get instant feedback aligned with official IB rubrics.
Advanced Tips/Strategies Section
To take your data analysis to the next level, consider these advanced tips:
- Statistical Analysis: Use statistical tests, such as t-tests or ANOVA, to determine the statistical significance of your results. This can provide stronger evidence to support your conclusions.
- Curve Fitting: Use curve fitting techniques to model the relationship between your variables. This can help you to predict future values and to identify underlying parameters.
- Residual Analysis: Analyze the residuals (the difference between the observed data and the predicted values) to assess the goodness of fit of your model.
- Sensitivity Analysis: Investigate how sensitive your results are to changes in your input parameters. This can help you to identify the most important factors affecting your experiment.
- Literature Review Integration: Go beyond simply comparing your results to literature values. Critically analyze the literature and discuss how your findings contribute to the existing body of knowledge.
Technology and Modern Assessment Section
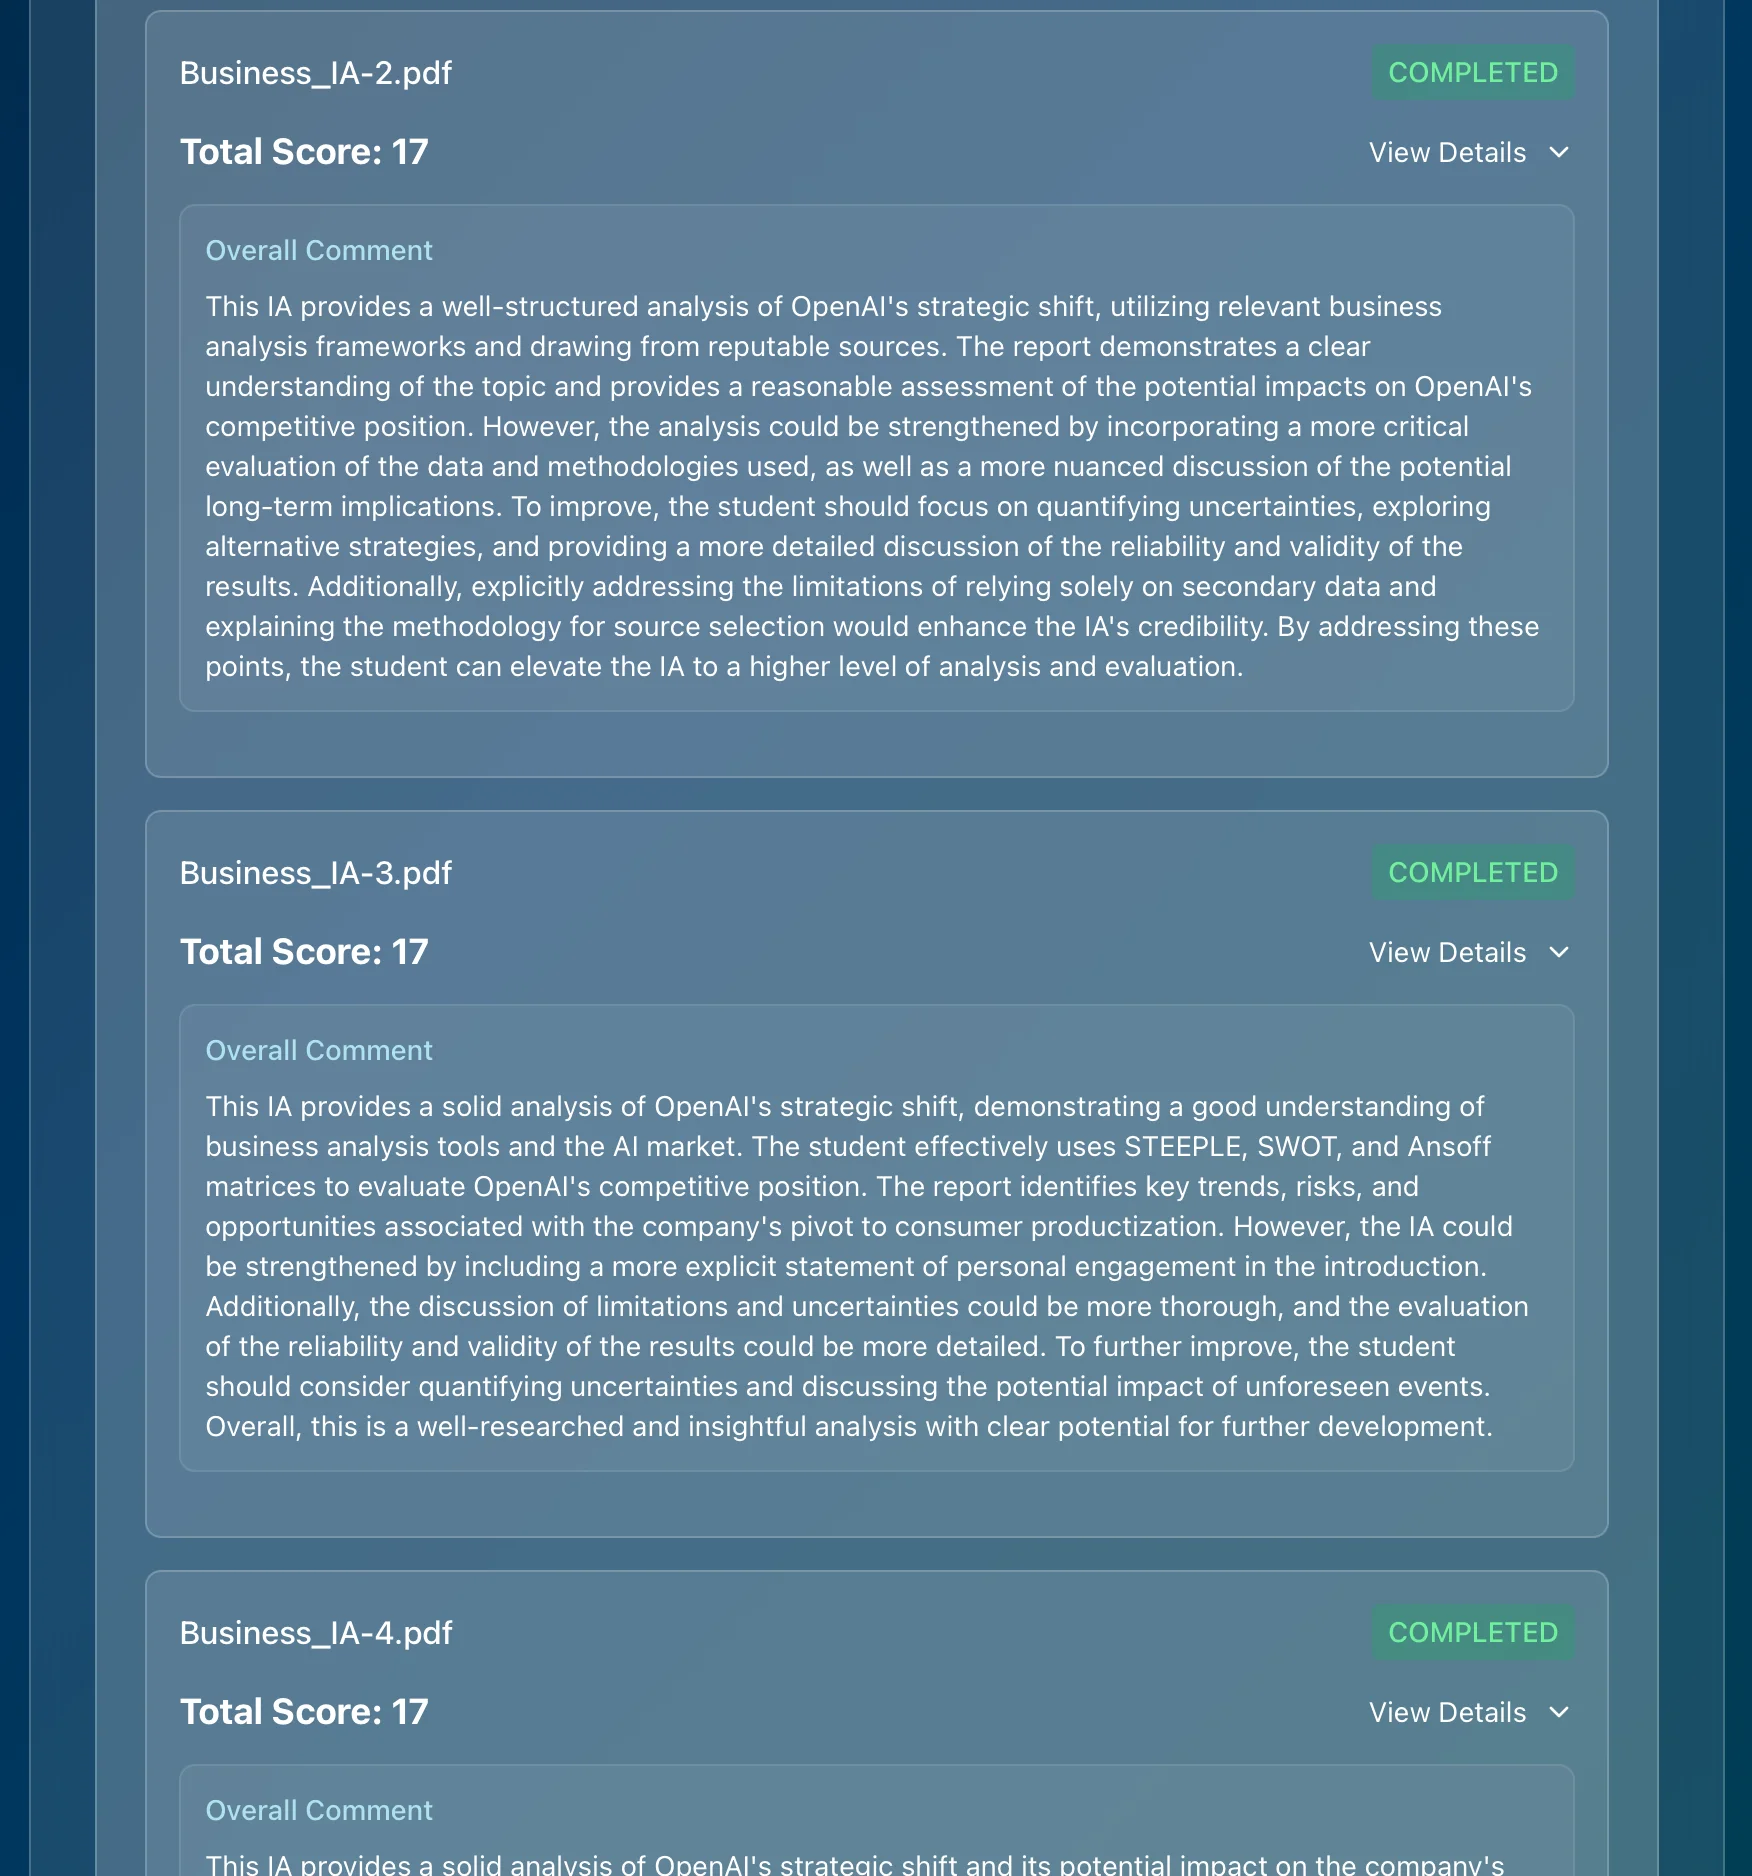
Technology is transforming the way we approach IB assessments, especially in areas like data analysis. AI-powered tools are becoming increasingly valuable for both students and teachers. For example, Marksy, as a leading AI grading assistant, can help teachers provide consistent, detailed feedback on IB Chemistry IAs.
Marksy analyzes student work against official IB rubrics, providing criterion-by-criterion feedback that highlights strengths and areas for improvement. This not only saves teachers valuable time but also ensures that students receive accurate and objective assessments. The AI algorithms use the official IB criteria to ensure accuracy and fairness, helping students understand exactly how to improve their work and achieve higher scores.
Furthermore, AI can assist students in identifying potential errors in their data analysis and presentation. By analyzing graphs, calculations, and conclusions, AI tools can flag inconsistencies, suggest improvements, and help students refine their work before submission. This collaborative approach, where students leverage AI to enhance their understanding and refine their work, is becoming increasingly common in modern IB education.
Conclusion with Clear Next Steps
Mastering data analysis and presentation is essential for success in your IB Chemistry IA. By following the guidelines outlined in this guide, you can ensure that your IA demonstrates a thorough understanding of chemical principles and your ability to apply them to real-world investigations. Remember to collect data accurately, process it appropriately, present it effectively, and interpret it thoughtfully.
Next Steps:
- Review your IA draft: Based on this guide, identify areas where you can improve your data analysis and presentation.
- Practice uncertainty propagation: Work through examples to ensure you understand the rules for calculating and propagating uncertainties.
- Experiment with different graph types: Use spreadsheet software to create different types of graphs and determine which ones best illustrate your data.
- Seek feedback from your teacher: Ask your teacher to review your data analysis and presentation and provide feedback.
- Try Marksy for free: See how Marksy can help you refine your IB Chemistry IA and achieve a higher score. Sign up for a free trial today and experience the power of AI-driven assessment feedback!