IB Geography IA: Mastering Fieldwork and Data Analysis
Struggling to navigate the IB Geography Internal Assessment (IA)? You're not alone! The IA is a significant component of your final IB Geography grade, and mastering fieldwork and data analysis is crucial for success. This comprehensive guide provides a step-by-step approach to crafting a high-scoring IA, covering everything from formulating a strong research question to effectively presenting and analyzing your findings. We'll delve into the intricacies of fieldwork techniques, data presentation methods, and analytical strategies, ensuring you understand exactly what's expected to achieve top marks. Get ready to transform your IA from a daunting task into a rewarding learning experience.
Introduction: Your Path to IA Success
The IB Geography Internal Assessment (IA) is your opportunity to showcase your geographical skills and understanding through independent research. It's a challenging but rewarding process that requires careful planning, execution, and analysis. This guide is designed to equip you with the knowledge and strategies needed to excel in your IA, focusing on the core elements of fieldwork and data analysis. We'll break down each stage of the IA process, providing practical tips and examples to help you navigate the complexities and achieve your desired score. Whether you're aiming for a 7 or simply want to improve your understanding, this guide will provide the tools you need to succeed.
Struggling with IB Assessments?
Get instant, detailed feedback on your work with AI that understands IB criteria.
Choosing a Compelling Fieldwork Question (Criterion A)
The foundation of a successful IA lies in a well-defined and geographically relevant research question). This question should be focused, manageable, and allow for primary data collection in a specific location.
Defining a Geographical Question
Your research question should be rooted in a geographical concept or theory. It should investigate a relationship between geographical phenomena and be answerable through fieldwork. Avoid overly broad questions that are difficult to investigate within the IA's scope.
Example of a weak question: How does tourism affect the environment? (Too broad)
Example of a strong question: To what extent does tourism-related litter impact the water quality of the River [Name] in [Location]? (Focused and specific)
Linking to the IB Geography Syllabus
Ensure your research question aligns with a topic covered in the IB Geography syllabus. This demonstrates your understanding of geographical concepts and their application to real-world situations. Referencing specific syllabus content in your IA will strengthen your argument and demonstrate your understanding.
Example: If your IA focuses on urban microclimates, explicitly mention the "Urban Environments" unit from the syllabus.
Presenting the Geographic Context
Clearly describe the geographic context of your fieldwork location. This includes providing relevant background information about the area's physical and human characteristics. Include maps that accurately depict the location and relevant features. Ensure your maps adhere to proper mapping conventions (title, legend, scale, orientation).
Tips for Mapping:
- Use GIS software (e.g., QGIS) to create professional-looking maps.
- Include multiple maps showing different scales (e.g., a regional map and a local map).
- Label key features and landmarks clearly.
Mastering Methods of Investigation (Criterion B)
The methods you use to collect data are critical to the validity and reliability of your IA. You need to describe your methods in detail and justify why they are appropriate for answering your research question.
Describing Data Collection Methods
Provide a clear and detailed description of the methods you used to collect data. This includes:
- Sampling Techniques: Explain how you selected your sampling locations (e.g., random, stratified, systematic).
- Data Collection Instruments: Describe the tools and equipment you used (e.g., water quality testing kits, questionnaires, GPS devices).
- Fieldwork Procedures: Outline the steps you took during data collection.
Example: "Water samples were collected at five locations along the river using sterile bottles. The pH, turbidity, and dissolved oxygen levels were measured using a portable water quality meter. The sampling locations were selected using a stratified random sampling technique, ensuring representation of different land use types along the river."
Justifying Your Methods
Explain why your chosen methods are appropriate for answering your research question. Consider the strengths and limitations of each method and how they contribute to the overall validity of your findings.
Example: "Using a water quality meter provides quantitative data that can be statistically analyzed to determine the extent of pollution. Stratified random sampling ensures that the data collected is representative of the entire river system."
Ensuring Data Reliability
Implement measures to ensure the reliability of your data. This includes:
- Calibration: Calibrate your instruments before each use.
- Replication: Collect multiple samples at each location.
- Standardization: Follow consistent procedures during data collection.
Quality and Treatment of Information Collected (Criterion C)
The quality and presentation of your data are crucial for demonstrating your understanding and analytical skills.
Relevance and Quantity of Data
Ensure that the data you collect is directly relevant to your research question and sufficient in quantity to allow for meaningful analysis. Avoid including irrelevant data that does not contribute to answering your question.
Example: If your research question focuses on the impact of tourism on water quality, collecting data on air temperature would be irrelevant.
Data Presentation Techniques
Choose appropriate data presentation techniques to effectively communicate your findings. Common techniques include:
- Graphs: Bar graphs, line graphs, scatter plots
- Tables: Summary tables, correlation tables
- Maps: Choropleth maps, dot density maps
- Photographs: Illustrate fieldwork locations and data collection procedures
Tips for Data Presentation:
- Use clear and concise labels and titles.
- Follow conventions for graph and table formatting.
- Choose appropriate scales and axes.
- Use color effectively to highlight key patterns.
Data Quality Control
Implement quality control measures to ensure the accuracy and reliability of your data. This includes:
- Data Validation: Check for errors and inconsistencies in your data.
- Outlier Analysis: Identify and investigate outliers.
- Data Transformation: Transform data to improve its suitability for analysis (e.g., logarithmic transformation).
Written Analysis: Unveiling Geographical Insights (Criterion D)
The written analysis is the heart of your IA. It's where you interpret your data, identify patterns and trends, and draw conclusions about your research question.
Descriptive and Statistical Techniques
Use descriptive statistics (e.g., mean, median, standard deviation) to summarize your data. Employ statistical techniques (e.g., t-tests, correlation analysis, regression analysis) to test hypotheses and identify relationships between variables.
Example: "The mean pH level in the upstream section of the river was 7.2, while the mean pH level in the downstream section was 6.5. A t-test revealed a statistically significant difference between the two groups (p < 0.05)."
Interpreting Trends and Patterns
Explain the trends and patterns you observe in your data. Relate these patterns to your research question, hypotheses, and geographic context.
Example: "The decrease in pH levels downstream suggests that pollution from agricultural runoff is impacting the water quality. This is consistent with the geographic context, as the downstream section of the river flows through an area with intensive agricultural activity."
Linking to Geographical Theory
Connect your findings to relevant geographical theories and concepts. This demonstrates your understanding of the broader geographical context and the significance of your research.
Example: "The observed pattern of decreasing water quality downstream aligns with the concept of point source pollution, where pollutants are discharged from a specific location (e.g., a sewage treatment plant)."
Addressing Anomalies
Identify and explain any anomalies or outliers in your data. These could be due to errors in data collection, unusual environmental conditions, or other factors.
Example: "One sampling location had an unusually high pH level compared to the other locations. This could be due to localized contamination from a nearby industrial site."
Conclusion: Summarizing Your Findings (Criterion E)
Your conclusion should provide a clear and concise answer to your research question, based on the analysis of your data.
Restating Your Research Question
Begin by restating your research question. This reminds the reader of the focus of your investigation.
Summarizing Key Findings
Summarize the key findings from your analysis. Highlight the most important patterns, trends, and relationships you observed.
Answering Your Research Question
Provide a clear and direct answer to your research question, based on your findings. Support your answer with evidence from your data.
Example: "Based on the analysis of water quality data, tourism-related litter has a significant impact on the water quality of the River [Name] in [Location]. The increased levels of pollutants in areas with high tourist activity suggest a direct link between tourism and water pollution."
Pro Tip: Get AI-Powered Grading
Stop second-guessing your grades. Get instant feedback aligned with official IB rubrics.
Evaluation: Reflecting on Your Methodology (Criterion F)
The evaluation is your opportunity to reflect on the strengths and weaknesses of your methodology and suggest improvements for future research.
Identifying Strengths and Weaknesses
Identify the strengths and weaknesses of your data collection methods, data analysis techniques, and overall research design.
Example: "A strength of the study was the use of a portable water quality meter, which allowed for accurate and reliable measurements. A weakness was the limited number of sampling locations, which may not have fully captured the spatial variability of water quality."
Suggesting Improvements
Suggest specific and realistic improvements for future research. Consider how these improvements could address the weaknesses of your current study.
Example: "Future research could increase the number of sampling locations to better capture the spatial variability of water quality. Additionally, incorporating a control group (e.g., a section of the river with no tourist activity) would provide a stronger basis for comparison."
Explaining Potential Impact
Explain how these improvements could impact the results of future research. Consider how they could lead to more accurate, reliable, and comprehensive findings.
Example: "Increasing the number of sampling locations and incorporating a control group would provide a more robust dataset and allow for a more accurate assessment of the impact of tourism on water quality."
Common Challenges and Mistakes in the IB Geography IA
Many students face similar challenges when completing their IB Geography IA. Here are some common mistakes to avoid:
- Vague Research Question: Ensure your research question is focused and specific.
- Inadequate Data Collection: Collect sufficient and relevant data to support your analysis.
- Poor Data Presentation: Choose appropriate data presentation techniques and follow conventions.
- Superficial Analysis: Analyze your data in depth and connect your findings to geographical theory.
- Weak Evaluation: Reflect critically on your methodology and suggest realistic improvements.
- Plagiarism: Ensure all sources are properly cited to avoid plagiarism.
Advanced Tips and Strategies for a Top-Scoring IA
To elevate your IA and achieve a top score, consider these advanced tips:
- Spatial Analysis: Incorporate spatial analysis techniques (e.g., GIS) to analyze geographical patterns and relationships.
- Remote Sensing: Use remote sensing data (e.g., satellite imagery) to analyze environmental changes over time.
- Modeling: Develop geographical models to simulate environmental processes and predict future outcomes.
- Critical Thinking: Demonstrate critical thinking skills by evaluating different perspectives and considering alternative explanations.
- Originality: Strive to conduct original research that contributes to the existing body of geographical knowledge.
Technology and Modern Assessment: The Role of AI
Technology is transforming the way we conduct and assess research in geography. AI-powered tools are becoming increasingly valuable for data analysis, visualization, and assessment.
The Power of AI in IB Assessment
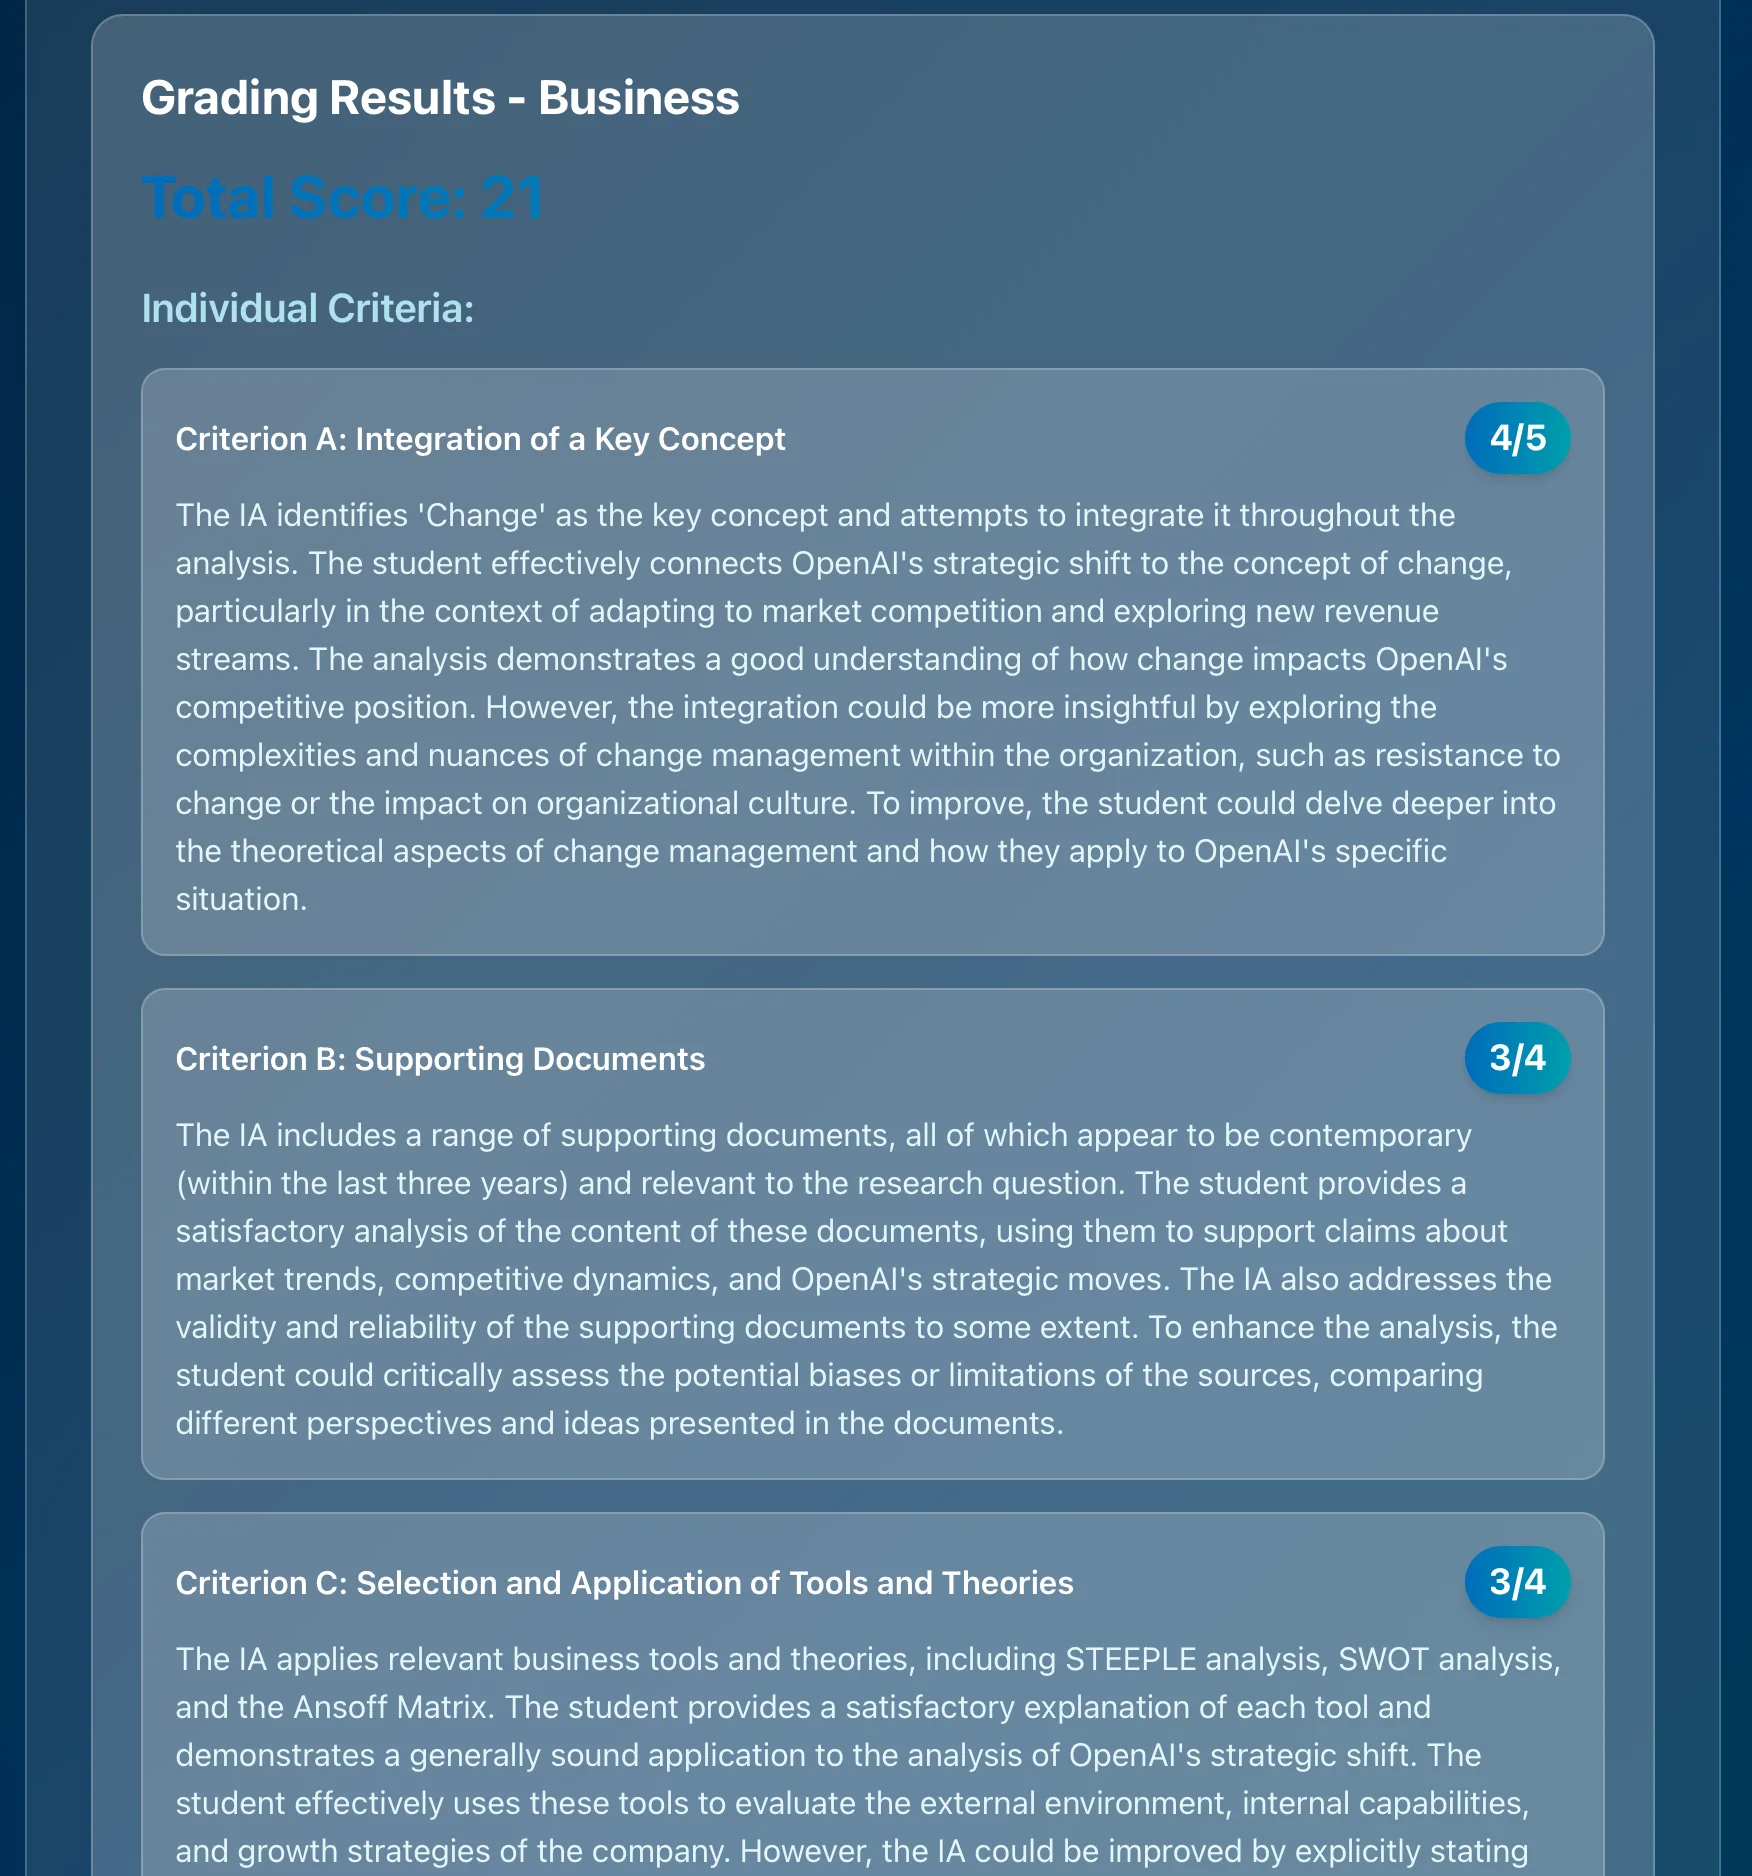
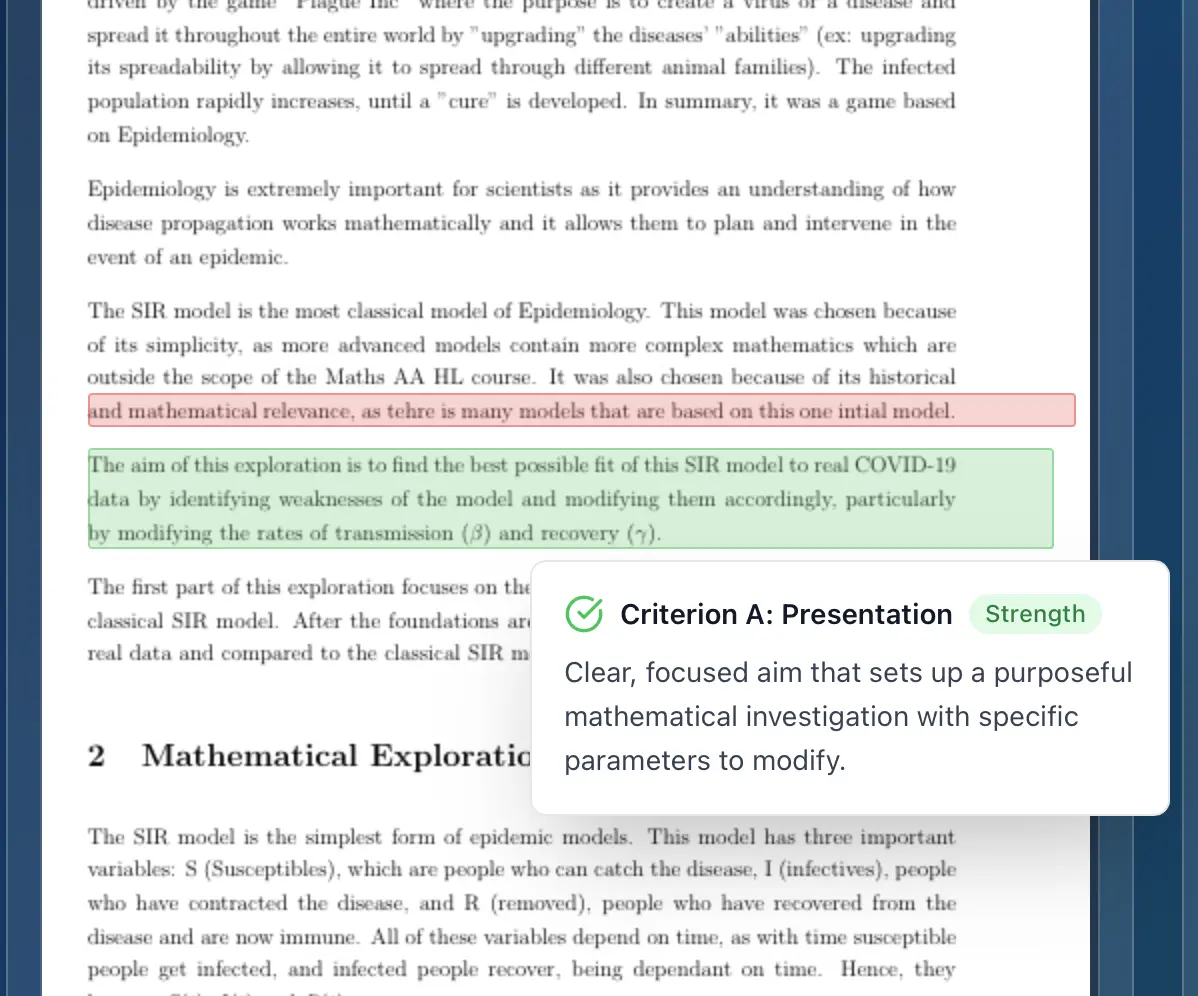
AI grading assistants, like Marksy, are revolutionizing the IB assessment process. These tools provide instant, accurate, and detailed feedback on student work based on official IB rubrics.
How Marksy Can Help You Excel
Marksy helps teachers provide consistent, detailed feedback on IB assessments, saving them valuable time while ensuring fairness and accuracy. By using official IB criteria, Marksy helps students understand exactly how to improve their work and achieve their desired scores.
Benefits of Using AI Grading Assistants:
- Rubric-Aligned Scoring: Ensures that assessments are graded according to official IB standards.
- Detailed Criterion-by-Criterion Feedback: Provides specific feedback on each assessment criterion.
- Suggestions for Improvement: Offers actionable suggestions for improving student work.
- Time-Saving Benefits: Reduces the time teachers spend on grading, allowing them to focus on teaching and student support.
Conclusion: Take Action and Achieve Your IA Goals
Mastering fieldwork and data analysis is essential for success in the IB Geography IA. By following the tips and strategies outlined in this guide, you can develop a strong research question, collect high-quality data, analyze your findings effectively, and write a top-scoring IA. Embrace the challenges, learn from your mistakes, and strive for excellence. Remember, the IA is not just an assessment; it's an opportunity to develop your geographical skills and deepen your understanding of the world around you.
Ready to take your IB Geography IA to the next level? Try Marksy for free today and experience the power of AI-driven assessment. Sign up for a free trial and see how Marksy can help you improve your IB scores or streamline your grading workflow!