- Albatrosses (belonging to the Family Diomedeidae) are large marine birds that can live for up to 50 years and feed at the highest trophic level. They have a very large wing span (up to 3m) and can use winds to travel long distances over water while foraging for food at sea. However, their survival and reproduction are threatened by both climate change and accidental death. This may be caused by being caught in the lines or nets of commercial fishing vessels that are in their foraging areas.
A 31-year study analysed population data of three different species: the wandering albatross (Diomedea exulans), the grey-headed albatross (Thalassarche chrysostoma) and the black-browed albatross (T. melanophris). All three species breed in colonies on the same island in the Antarctic.
(a) Although they feed at the highest trophic level, their survival can be threatened by processes in the lowest levels of the food chain.
(i) Suggest a change that could occur in a food chain that would affect the survival of albatrosses. [1]
(ii) Suggest how climate change could impact albatross survival. [1]
(Question 1 continued)
The graphs show the number of breeding pairs for each species over a 22-year period.
(b) Describe the trend in the number of breeding pairs in the three species over the 22-year period. [1]
(Question 1 continued)
(c) The graphs show the percentage of albatrosses that survive to the end of each year with respect to the population at the start of the same year (annual survival). Data for two species of albatross was recorded over a 31-year period.
(i) Compare and contrast the data on the annual survival of the wandering and grey-headed albatrosses over the 31-year period. [3]
(ii) Suggest a reason for the differences in survival between the two species. [1]
(Question 1 continued)
(d) The scientists looked for possible correlations between the percentage of adult wandering albatross that survived each year (annual survival) and human fishing efforts over the period shown in the graphs. A higher fishing effort refers to more fish caught.
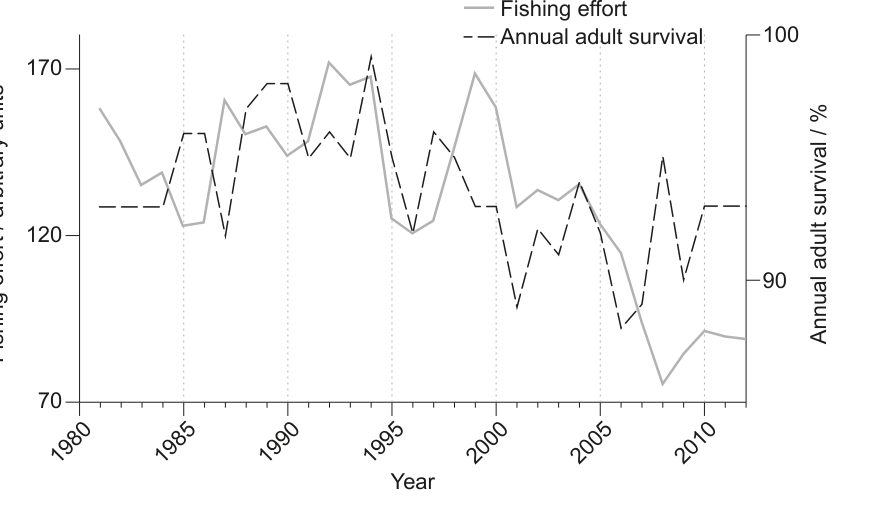
(i) State the year with the highest fishing effort. [1]
(ii) Using evidence from the graph, describe the relationship between fishing effort and adult survival over the years. [2]
(Question 1 continued)
(e) Krill are tiny marine crustaceans that have a very important role in the Antarctic food chains. Krill are a major source of food for many marine species, including whales, seals, fish and albatrosses. The graph shows the survival of adult grey-headed albatross related to krill density between 1996 and 2011.
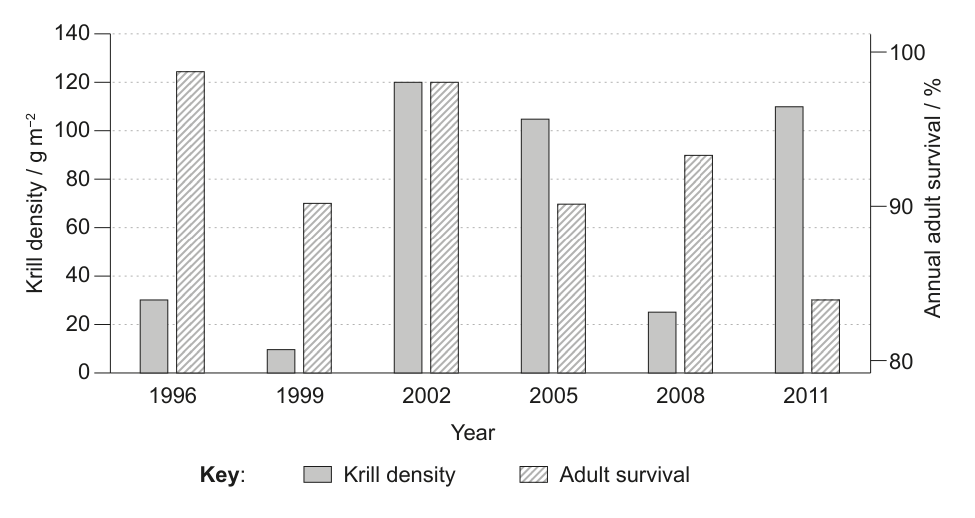
(i) Calculate the percentage increase in krill density from 1996 to 2002. [1]
(ii) Evaluate the hypothesis that the annual adult survival of the grey-headed albatross is dependent on changes in krill density, making reference to changes over specific periods of time. [2]
(Question 1 continued)
Different aspects of the life cycle of the black-browed albatross were studied in relation to two variables.
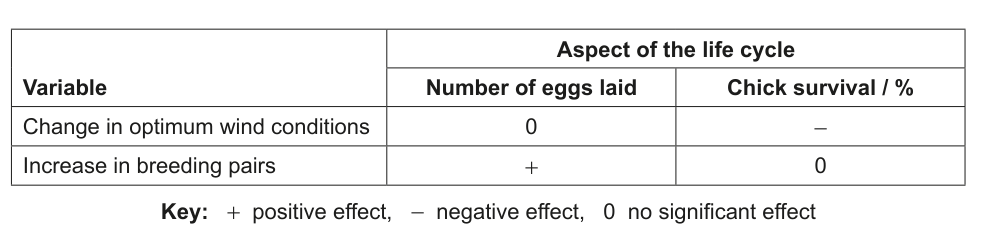
| Variable | Aspect of the life cycle |
| :--- | :--- | :--- |
| | Number of eggs laid | Chick survival / % |
| Change in optimum wind conditions | 0 | - |
| Increase in breeding pairs | + | 0 |
Key: + positive effect, - negative effect, 0 no significant effect
(f) Using all the information presented, suggest two possible reasons for the effect of each variable on the two aspects of the life cycle shown in the table. [4]