Question 21

From Chemistry HL Paper 1 (May 2024, TZ2)

  1. The mass of a flask containing excess calcium carbonate, CaCO3(s), reacting with 100 cm3 of 0.50 mol dm−3 hydrochloric acid, HCl(aq), was monitored with time at 25 °C.
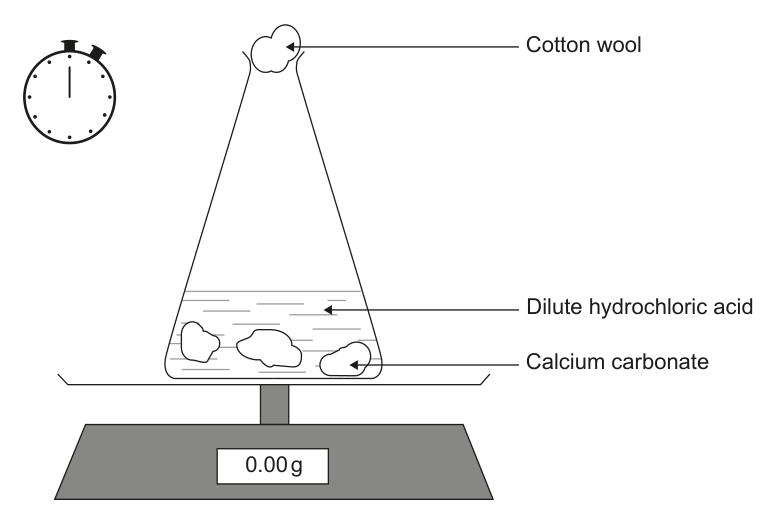
Diagram showing a flask on a balance, containing calcium carbonate and dilute hydrochloric acid, with cotton wool in the neck, and a stopwatch.

Curve I was obtained under these conditions.
Which curve corresponds to the experiment when it was repeated at the same temperature using the same mass of same sized pieces of calcium carbonate and 50 cm3 of 0.50 mol dm−3 hydrochloric acid?
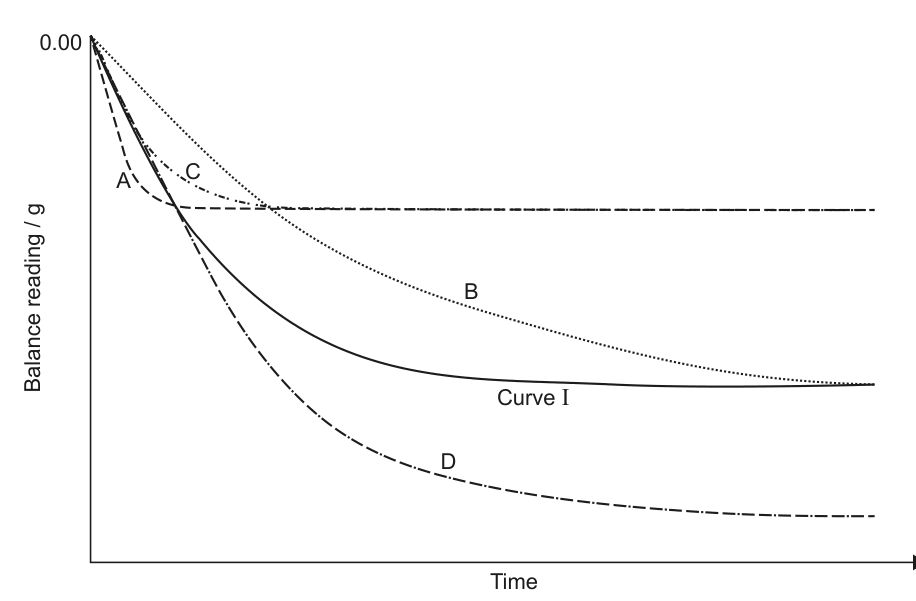
Graph showing balance reading (g) vs. time, with four curves labeled A, B, C, D, and Curve I.