- [Maximum mark: 16]
The following diagram shows parts of the graphs of two functions and .
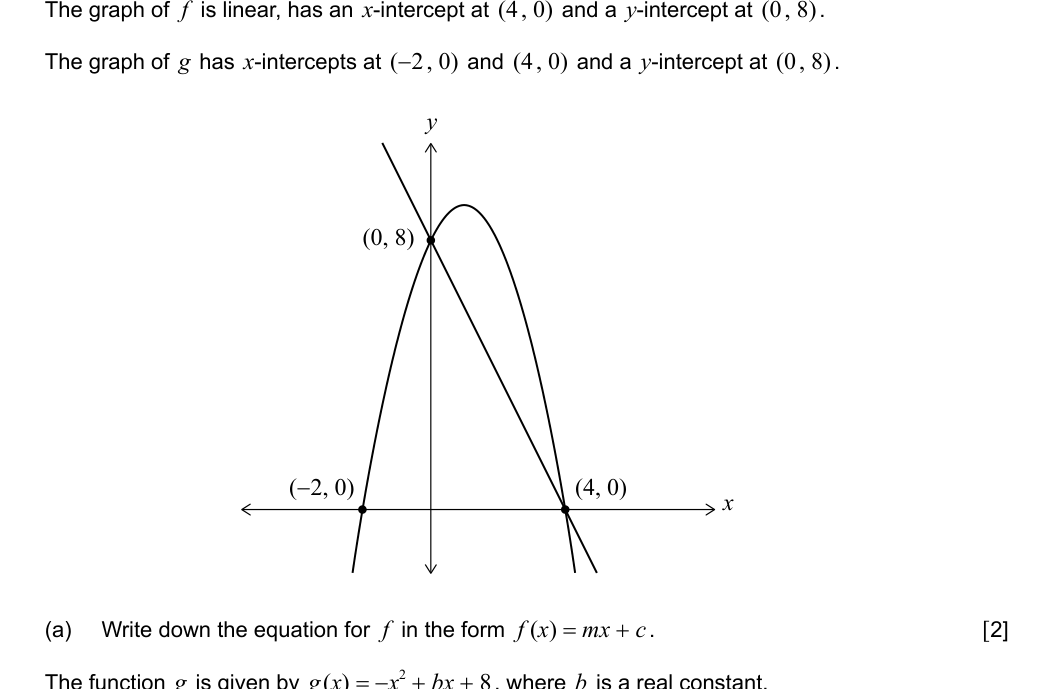
The graph of is linear, has an x‑intercept at and a y‑intercept at .
(a) Write down the equation for in the form . [2]
The function is given by , where is a real constant.
(b) Find the value of . [3]
(c) Show that the area of the region enclosed by the graph of and the graph of can be represented by the definite integral . [2]
(d) Hence, find the area of the region enclosed by the graph of and the graph of . [4]
Point is on the graph of . The tangent to the graph of at is parallel to the graph of .
(e) Find the coordinates of . [5]