- [Maximum mark: 14]
MyLife is a social media platform with 93.6 million users, all aged 13 years old and above. The following frequency table shows the number of users by age group.
| Age, (years) | Millions of users |
|---|---|
| 5.5 | |
| 23.6 | |
| 43.5 | |
| 17.3 | |
| 3.7 | |
| Total | 93.6 |
(a) Find the percentage of MyLife users aged 45 years or older. [1]
(b) A sample of 1000 MyLife users is chosen at random. Find the probability that fewer than 200 of them are aged 45 years or older. [3]
(c) Given that a MyLife user chosen at random is 45 years or older, find the probability that they are 65 years or older. [4]
(d) List the mid‑interval value for each class interval. [1]
(e) Hence, for MyLife users, estimate
(i) the mean age;
(ii) the variance of the ages. [3]
(This question continues on the following page)
(Question 7 continued)
A different social media platform, SmallTalk, reports that its users have a mean age of 29.9 years and a variance of 137 years.
The following four diagrams represent age distributions.
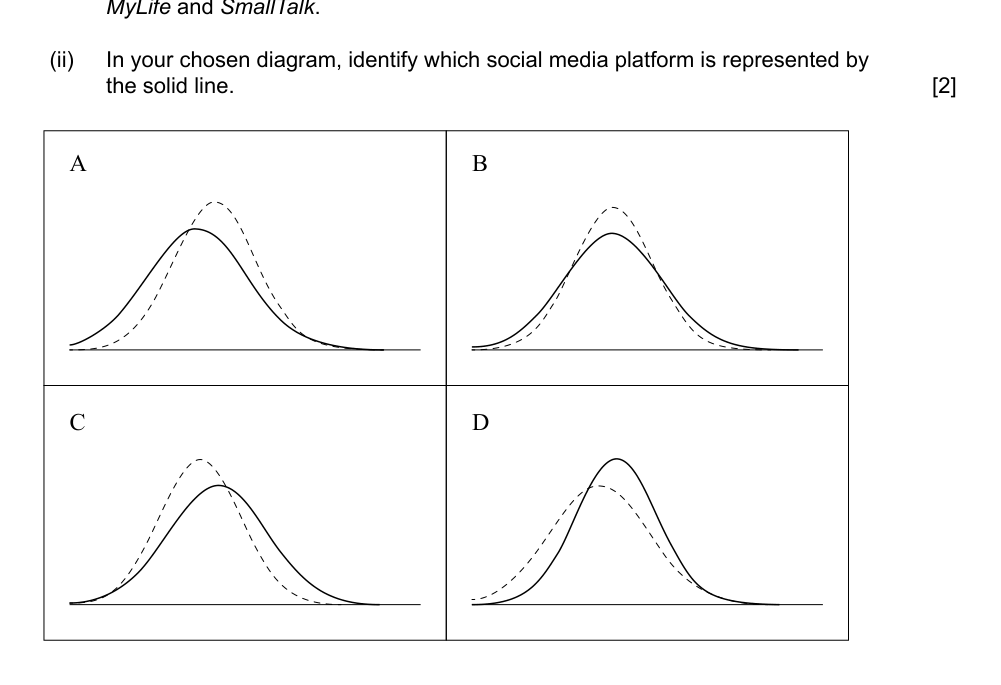
(f) (i) Identify the diagram which best represents the age distributions for the users of MyLife and SmallTalk.
(ii) In your chosen diagram, identify which social media platform is represented by the solid line. [2]