- Phosgene (carbonyl dichloride, Cl₂CO) is an important industrial intermediate.
(a) Phosgene may be formed by the free‑radical reaction between carbon monoxide, CO, and chlorine, Cl₂, which is initiated by UV light.
(i) Write an equation for the initiation reaction. [1]
(ii) State the type of bond fission that is occurring. [1]
(iii) Determine the enthalpy change for the reaction between carbon monoxide and chlorine from bond enthalpies. Use section 12 of the data booklet. [3]
(iv) Sketch an energy profile for this reaction and label the “Reactants”, “Products” and “∆H”. [2]
(v) Calculate the standard entropy change, ∆S°, of the reaction between carbon monoxide and chlorine to form phosgene. Use section 13 of the data booklet and the following data: Standard entropy S° of chlorine = 223 J mol⁻¹ K⁻¹, Standard entropy S° of phosgene = 284 J mol⁻¹ K⁻¹. [1]
(vi) Deduce whether the reaction would go to completion or reach equilibrium at 298 K. Use sections 1 and 2 of the data booklet along with your answers to (a)(iii) and (a)(v). [3]
(b) Phosgene gradually decomposes in the environment according to the equation: Cl₂CO(g) + H₂O(g) → CO₂(g) + 2 HCl(g)
(i) Suggest how the rate of this reaction could be followed at constant temperature. [1]
(ii) Outline why some collisions between reactant molecules do not result in a reaction occurring. [2]
(iii) Write the rate equation for the reaction if it is first order with respect to each reactant. [1]
(iv) If the reaction occurs in a dilute aqueous solution of phosgene it appears to be first order overall. Outline why this is consistent with the answer to (b)(iii). [1]
(v) The activation energy of this reaction was found by measuring the reaction rate over a range of absolute temperatures, T. The following graph was plotted: [Figure: A graph showing a downward sloping line.] State and label the axes of the graph. [1]
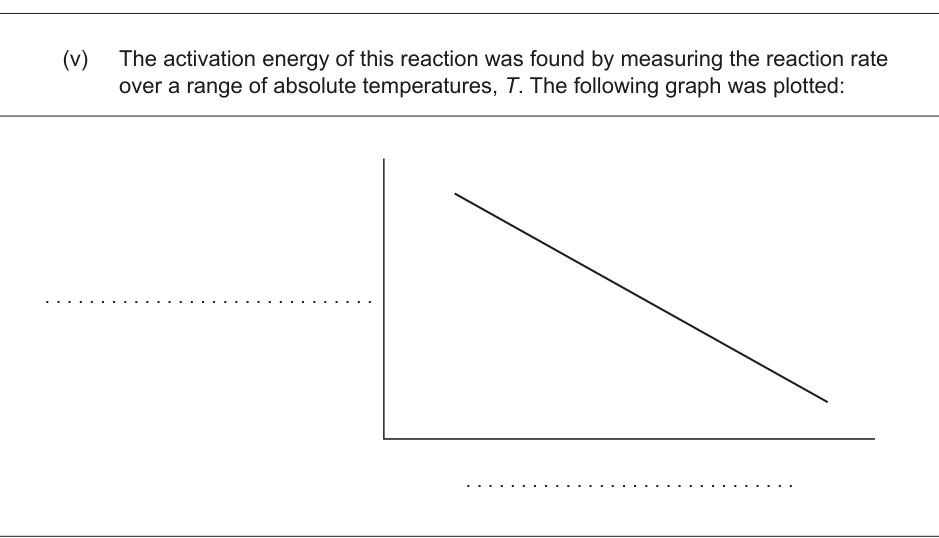
(vi) Calculate the gradient of the line on the graph in (b)(v) if the activation energy is 12 kJ mol⁻¹. Use sections 1 and 2 of the data booklet. [1]
(vii) Sketch a Maxwell–Boltzmann energy distribution curve at a higher temperature than the one shown. [1]
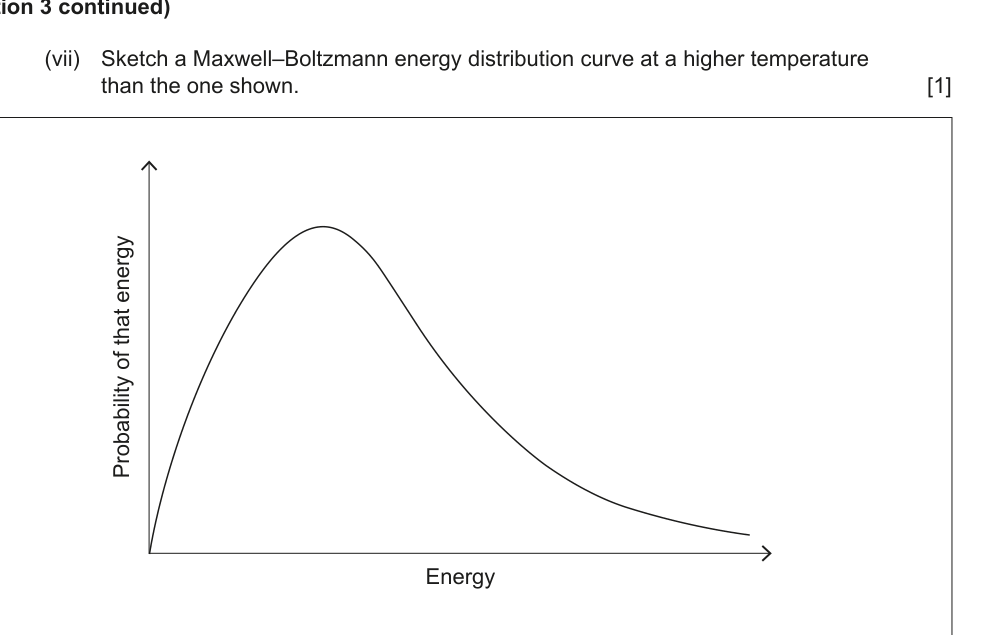
(viii) Explain why the rate of reaction increases as the temperature is increased. Support your answer by annotating the diagram in (b)(vii). [2]
(ix) Describe two observations which confirm that a solid, added to the reaction mixture, is acting as a catalyst. [2]
(c) The mass spectrum of phosgene is shown. [Figure: A mass spectrum graph with peaks at m/z 28, 35, 63, 65, and others.]
(i) Outline why there are peaks at m/z values less than that of the molecular ion. [1]
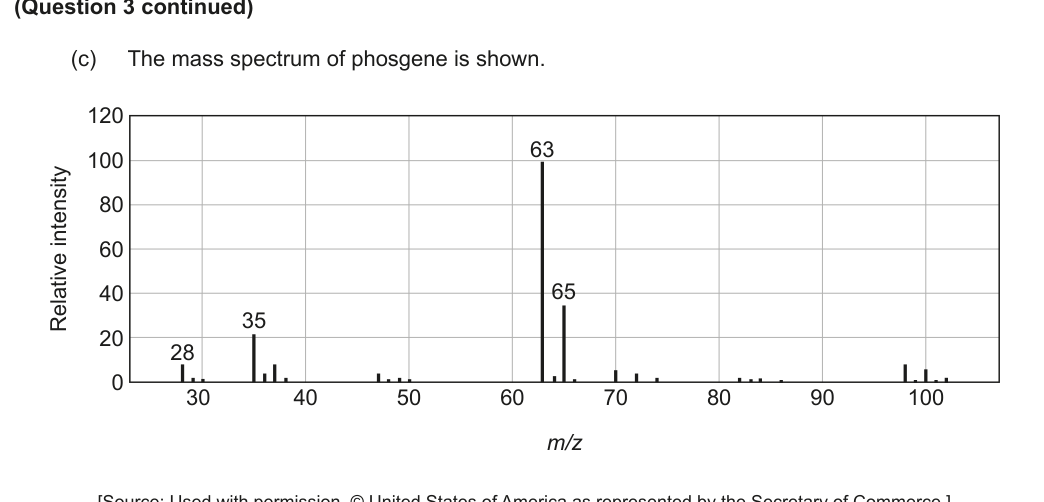
(ii) Deduce the formula of the fragment that occurs at m/z = 63. [1]
(iii) Predict the main features of IR and ¹H NMR spectra of phosgene. Use section 20 of the data booklet. [2]