- The equation describes the behaviour of an ideal gas.
A student tests a fixed mass of gas to confirm that, for a constant temperature,
where is a constant.
The student does this by making measurements of and .
Five sets of data for this experiment are shown in the table. Four processed values of are also shown.
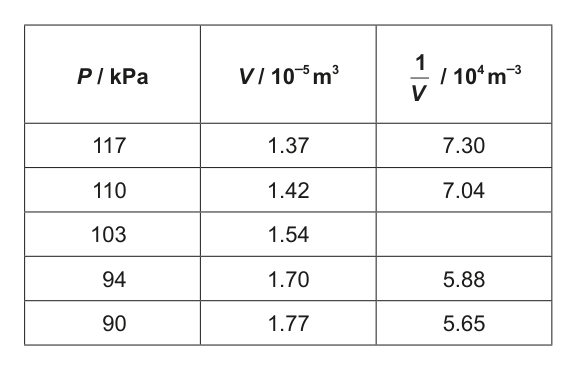
The variation of with is shown for four data points.
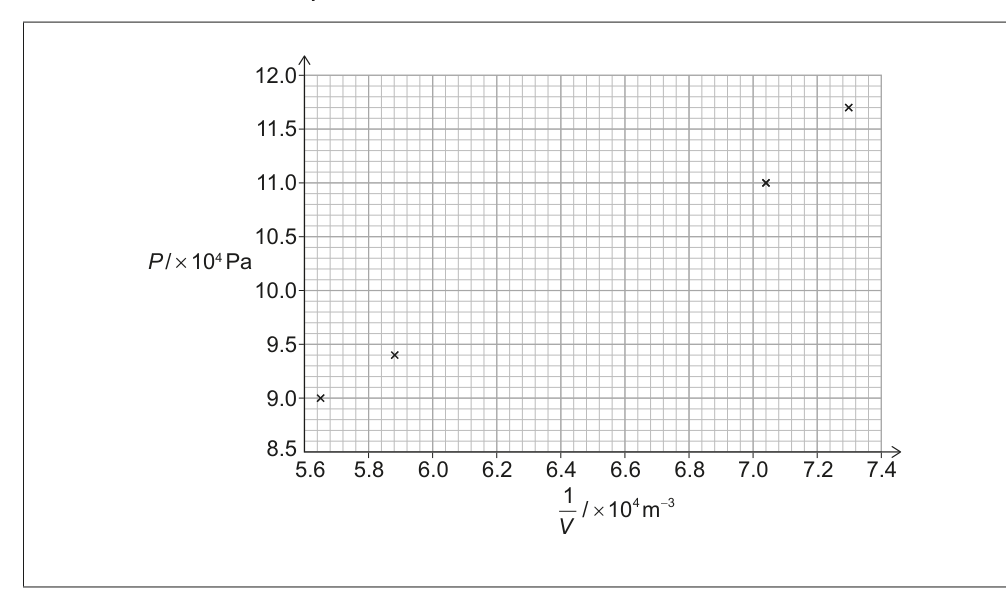
(a) (i) Plot the missing data point on the graph. [1]
(ii) Draw the best-fit line on the graph. [1]
(iii) Explain how the student can use the graph to decide whether the data support the relationship . [3]
(b) (i) Determine . [2]
(ii) State an appropriate SI unit for . [1]
(c) The laboratory is at a constant temperature of .
Determine the number of molecules in the fixed mass of gas. [1]