Question 21

From Biology HL Paper 1 (May 2024, TZ2)

  1. The graph shows pressure changes in the left side of the heart during one cardiac cycle.
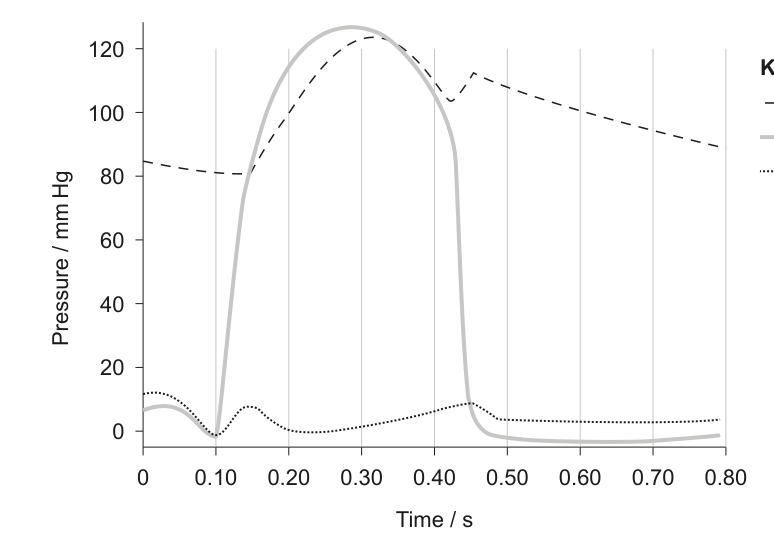
Line graph with three lines representing pressure changes in the aorta, left ventricle, and left atrium over time. The x-axis is 'Time / s' from 0 to 0.80, and the y-axis is 'Pressure / mm Hg' from 0 to 120. A key identifies the lines for aorta (dashed), left ventricle (solid grey), and left atrium (dotted).

How long does the atrioventricular valve remain open during one cardiac cycle?

Textbook topics in this question

Review the exact course sections assessed by each question part.