Question 22

From Biology HL Paper 1 (May 2024, TZ2)

  1. The diagram shows changes in the uterus lining of a woman throughout her menstrual cycle.
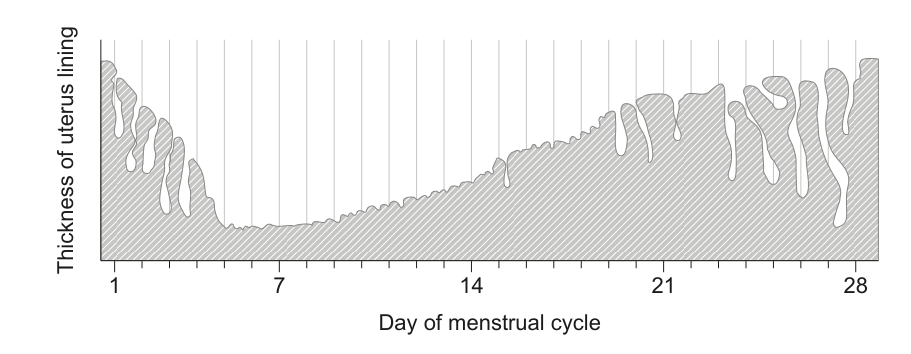
A line graph showing the thickness of the uterus lining over a 28-day menstrual cycle. The y-axis is 'Thickness of uterus lining' and the x-axis is 'Day of menstrual cycle', with labels at 1, 7, 14, 21, and 28. The lining thickness fluctuates, decreasing at the beginning, then increasing, and then decreasing again towards the end.

Between which days is she likely to be fertile?

Textbook topics in this question

Review the exact course sections assessed by each question part.