- The graph shows the correlation between blood glucose and liver glycogen concentrations in animals after receiving different glucose meals.
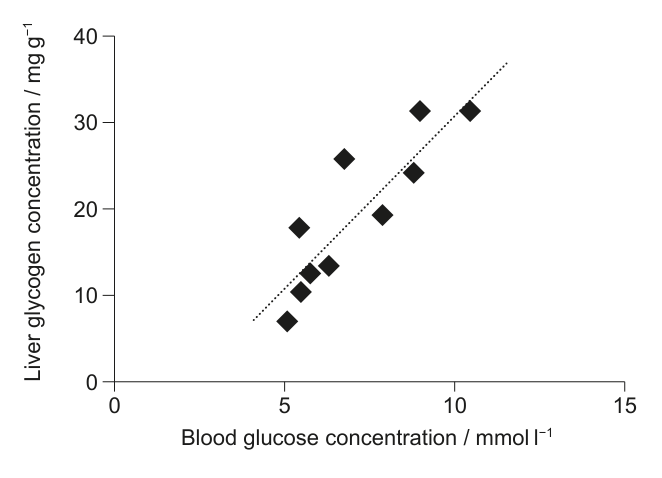
Which statement explains the correlation shown in the graph?
Which statement explains the correlation shown in the graph?
Review the exact course sections assessed by each question part.