Question 29

From Biology HL Paper 1 (May 2024, TZ2)

  1. A group of students investigated the effect of increasing substrate concentration on the rate of an enzyme-catalysed reaction in the presence of two inhibitory substances. The results are shown in the graph.
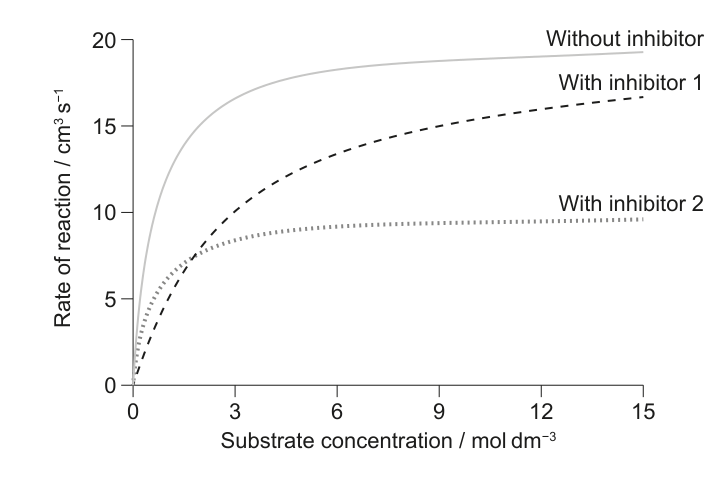
A line graph with 'Substrate concentration / mol dm-3' on the x-axis and 'Rate of reaction / cm3 s-1' on the y-axis. Three curves are shown: 'Without inhibitor', 'With inhibitor 1', and 'With inhibitor 2'. The 'Without inhibitor' curve shows the highest reaction rate, followed by 'With inhibitor 1', and then 'With inhibitor 2'.

What can be deduced from these results?

Textbook topics in this question

Review the exact course sections assessed by each question part.