- The graph shows the effect of increasing light intensity on the rate of photosynthesis during an experiment carried out at optimum temperature and normal atmospheric CO2 concentration.
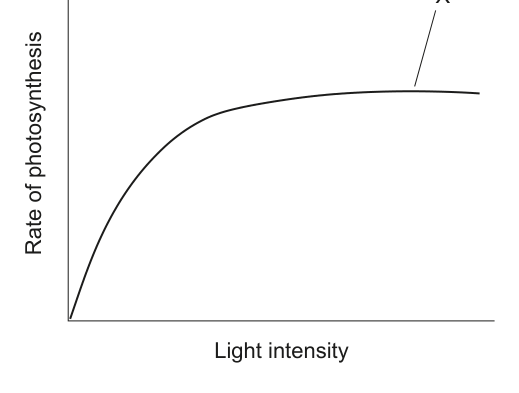
Which factor could be limiting photosynthesis at point X on the graph?