Question 18

From Biology HL Paper 1A (May 2025, TZ2)

  1. The graph shows changes in blood plasma glucose concentration before exercise, during exercise and during recovery with and without epinephrine (adrenaline) infusion. Epinephrine infusion was started 30 minutes into the exercise routine.
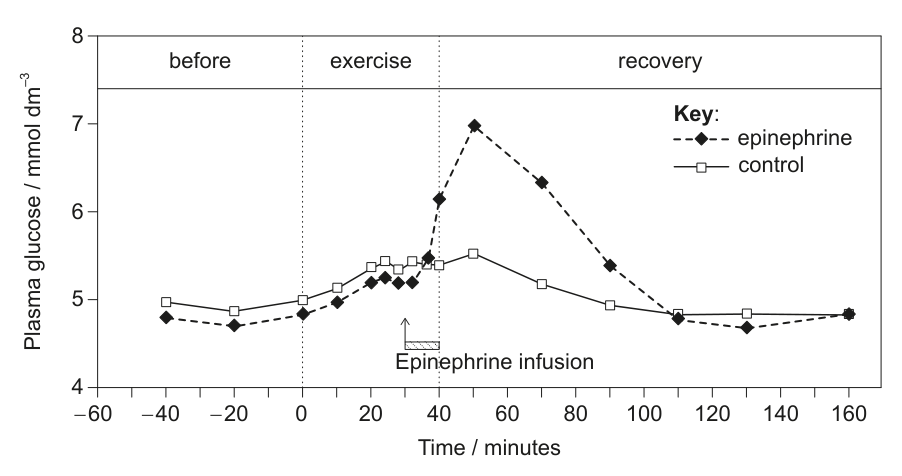
Line graph with two lines, one for epinephrine and one for control, showing plasma glucose concentration (mmol dm^-3) on the y-axis and time (minutes) on the x-axis. The graph is divided into 'before', 'exercise', and 'recovery' phases, with an 'Epinephrine infusion' indicated during the exercise phase.

Which action of epinephrine would result in the observed changes to plasma glucose concentration?

Textbook topics in this question

Review the exact course sections assessed by each question part.