- Oxygen dissociation curves show the percentage of oxygen saturation of adult haemoglobin (Hb) at different oxygen concentrations, as measured in partial pressure of oxygen (pO2).
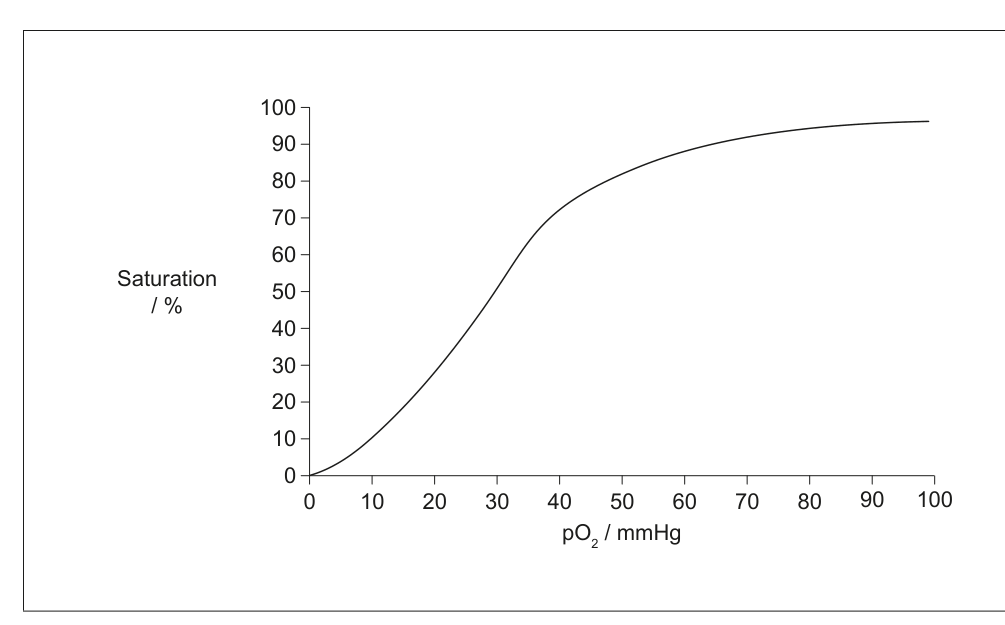
(a) Identify the percentage of oxygen saturation of haemoglobin at a partial pressure of 40 mmHg. [1]
(b) Describe the relationship between partial pressure of oxygen (pO2) and percent saturation of haemoglobin. [2]
(c) On the graph, sketch an oxygen dissociation curve for foetal haemoglobin. [1]
(d) Describe an adaptation of haemoglobin for the transport of oxygen. [1]
(e) Describe how tidal volume can be measured in a human. [3]