- The graph shows results of an experiment by Hershey and Chase in 1952, in which bacteria were infected with a mixture of virus particles labelled with 32P or 35S isotopes. A suspension of the infected bacteria was agitated with a blender, and samples collected from the suspension were centrifuged to record the percentage of isotope remaining directly outside of the cells.
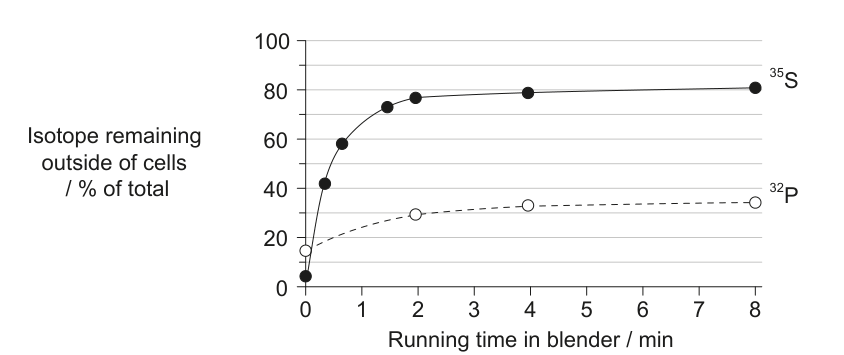
(a) Calculate the difference between the percentages of 35S and 32P remaining outside bacterial cells at 2 minutes. [1]
(b) Explain how this data provides evidence that DNA is the genetic material of cells. [3]
(c) (i) Draw a labelled diagram to show the structure of a DNA nucleotide. [3]
(ii) List the DNA nucleotides that are purines and pyrimidines. [1]
Purines:
Pyrimidines: