- Bumblebees (Bombus terrestris) are insects that have both individual and social learning capacities. Scientists trained individual bumblebees to push either a blue tab or a red tab on a puzzle box to rotate the lid, exposing a reward consisting of a sucrose solution.
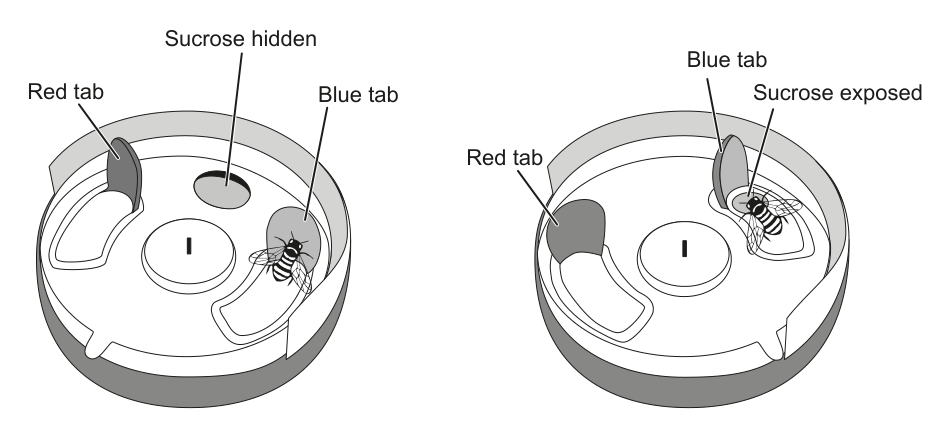
Individual trained bumblebees were then mixed with untrained bumblebees to determine if the trained ones could teach the untrained ones how to expose the sucrose solution. All groups had the same number of bumblebees.
Experimental groups:
• B: 1 bumblebee trained to open the blue tab plus untrained bumblebees
• R: 1 bumblebee trained to open the red tab plus untrained bumblebees
• C (control): no trained bumblebees, only untrained bumblebees
The bumblebees in each group were allowed to try and open the puzzle box. Untrained bumblebees were considered to have become "learners" when they opened the puzzle box twice.
(Question 1 continued)
The line graph shows the number of learners per day in the different groups.
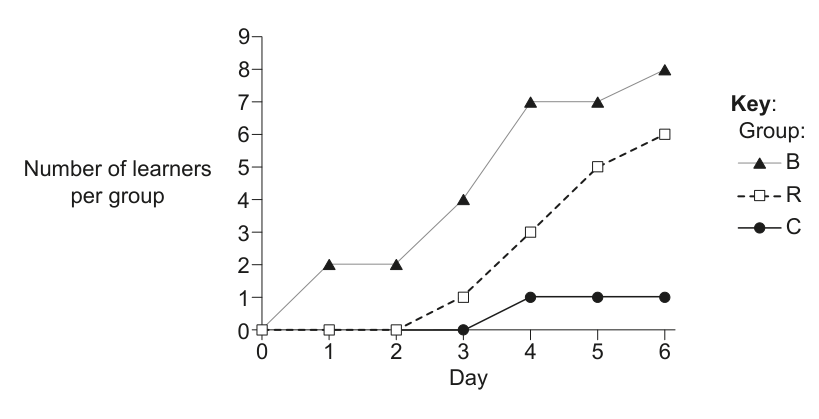
(a) State the number of learners in the R group on day 6. [1]
(b) Compare and contrast the trends in the number of learners for the B group and R group over the course of the investigation. [2]
(c) Calculate the percentage increase in the number of learners in the R group between days 3 and 6. [1]
%
(Question 1 continued)
The total number of times a puzzle box was opened to expose the sucrose solution by pushing either the blue tab or the red tab was recorded for each group after 6 days.
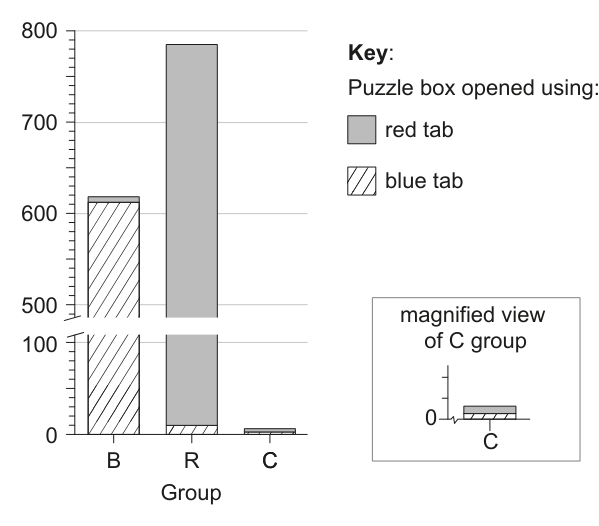
(d) Estimate the total number of times the puzzle box was opened using the red tab in the B group. [1]
(e) Using all the data provided, suggest with a reason which group is more efficient at opening the puzzle box. [1]
(Question 1 continued)
The bumblebees were allowed to open the puzzle box for a total of 12 days, and the number of times the puzzle box was opened with either colour tab was recorded. Blue tab learners and red tab learners were combined.
Learner proficiency indexes (LPI) were calculated for each individual learner as follows:
LPI = Total times a puzzle box was opened / Number of days to become a learner
The results for the learners in the B and R groups were combined (B+R) and compared with the control group (C). The box-and-whisker plot shows the LPI for each individual bumblebee in groups B+R and C.
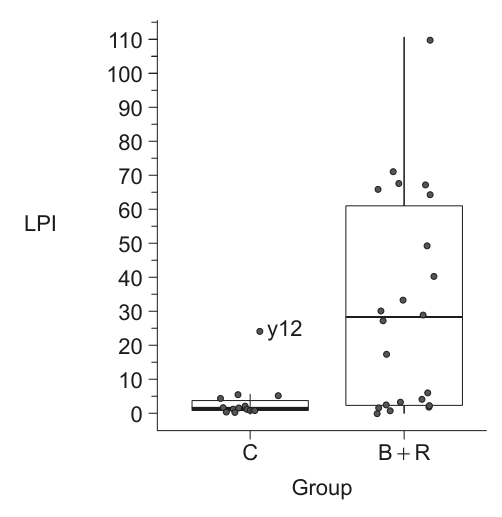
(f) Determine which percentage of the B+R group had an LPI of 28 or less. [1]
(Question 1 continued)
The most proficient learner in the C group, bumblebee y12, was an outlier with 216 box openings recorded during the experiment.
(g) (i) State the LPI for bumblebee y12. [1]
(ii) Calculate the number of days it took bumblebee y12 to become a learner. [1]
Scientists concluded that puzzle box opening could arise spontaneously in the absence of social learning, but found that bumblebees that learned from trained bumblebees were significantly more proficient at puzzle box opening than learners from untrained (control) groups.
(h) Justify this conclusion using all the data provided. [3]