- The graph shows monthly mean atmospheric carbon dioxide concentrations measured at Mauna Loa Observatory, Hawaii in 2020 and 2021.
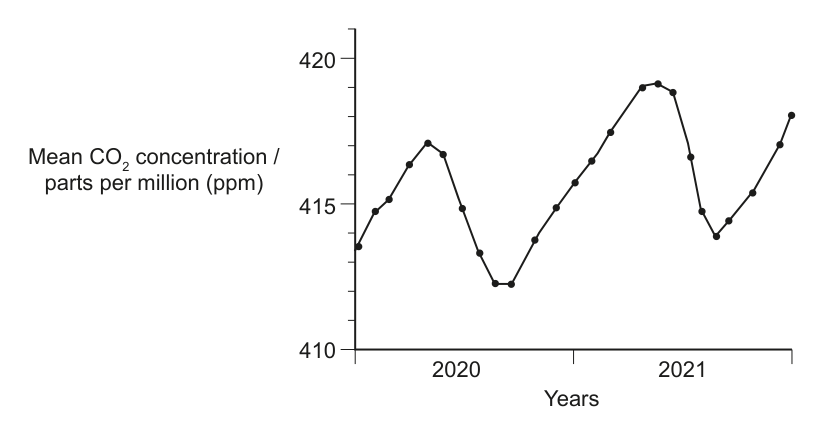
Which processes contribute to changes in monthly mean atmospheric carbon dioxide concentrations?
Which processes contribute to changes in monthly mean atmospheric carbon dioxide concentrations?
Review the exact course sections assessed by each question part.