The graph shows pressure changes during the cardiac cycle.
Graph showing pressure changes during the cardiac cycle with pressure in mmHg on the y-axis and time on the x-axis (implied). Three lines, X, Y, and Z, represent different pressure changes.
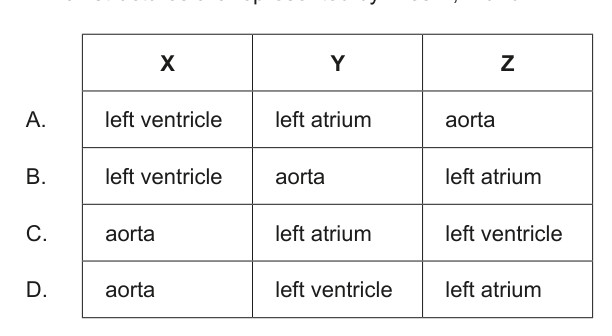
Which structures are represented by lines X, Y and Z?
Table with four rows (A-D) and three columns (X, Y, Z) providing different combinations of anatomical structures (left ventricle, left atrium, aorta) for lines X, Y, and Z from the cardiac cycle graph.
Textbook topics in this question
Review the exact course sections assessed by each question part.