- The graph shows the concentration of methyl mercury during degradation by Pseudomonas putida in experimental tubes after 0, 4, 8, 12 and 24 hours of incubation. It also shows the growth of P. putida in the presence and absence of methyl mercury.
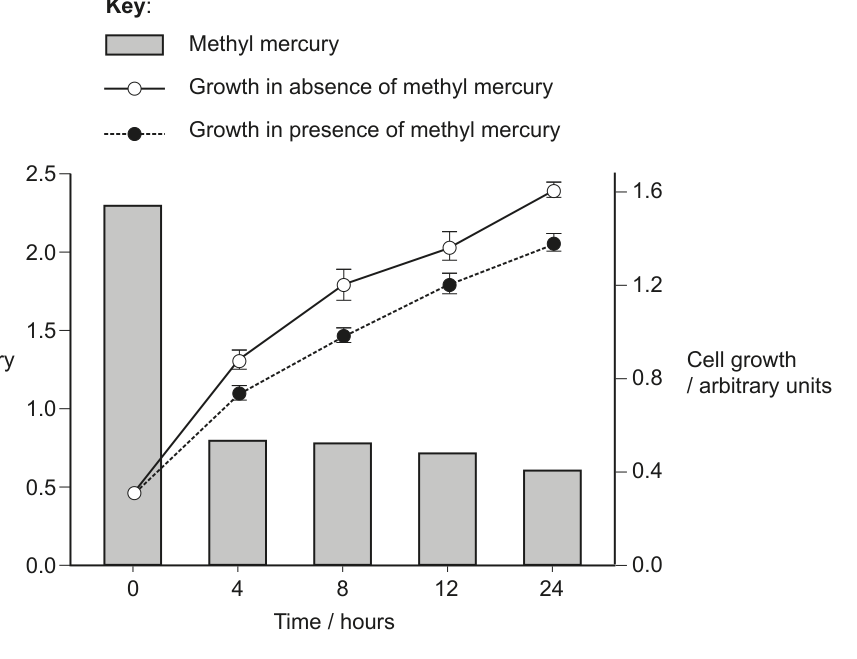
(a) State one chemical other than mercury produced in the degradation of methyl mercury by P. putida. [1]
(b) Using the data, evaluate whether P. putida is an effective microorganism for methyl mercury bioremediation. [2]