- The sinking of the tanker Eurobulker off the coast of Greece in September 2000 resulted in a spill of 700 tonnes of crude oil. The sands in the oil spill region were categorized according to the level of pollution and the presence of indicator species.
The graph shows the trends in richness of all species in the five ecological quality status categories in sands after the oil spill.
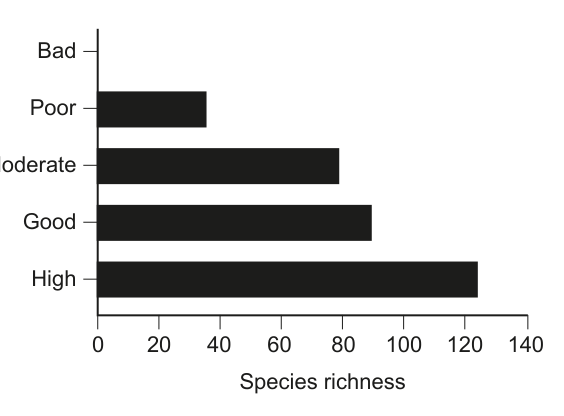
(a) Analyse the data to show that pollution affects biodiversity. [2]
(b) Outline how the biomagnification of chemicals from crude oil could occur in marine food chains. [3]