- The diagram of a normal electrocardiogram (ECG) trace shows two cardiac cycles.
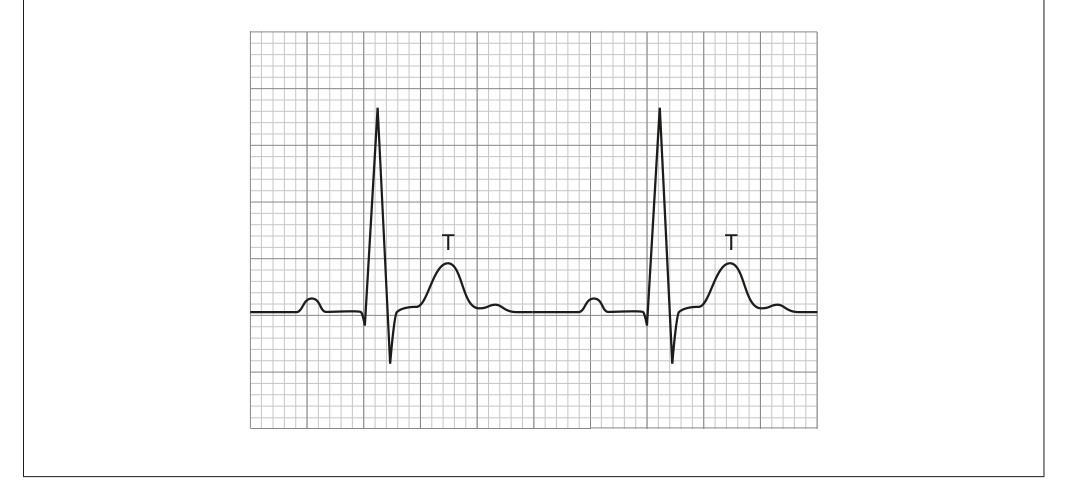
(a) Annotate the diagram to show the wave produced by
(i) the contraction of the atria; [1]
(ii) the contraction of the ventricles. [1]
(b) State the stage of the cardiac cycle shown at T. [1]
(c) Explain how the structure of cardiac muscle cells is adapted to their function. [3]