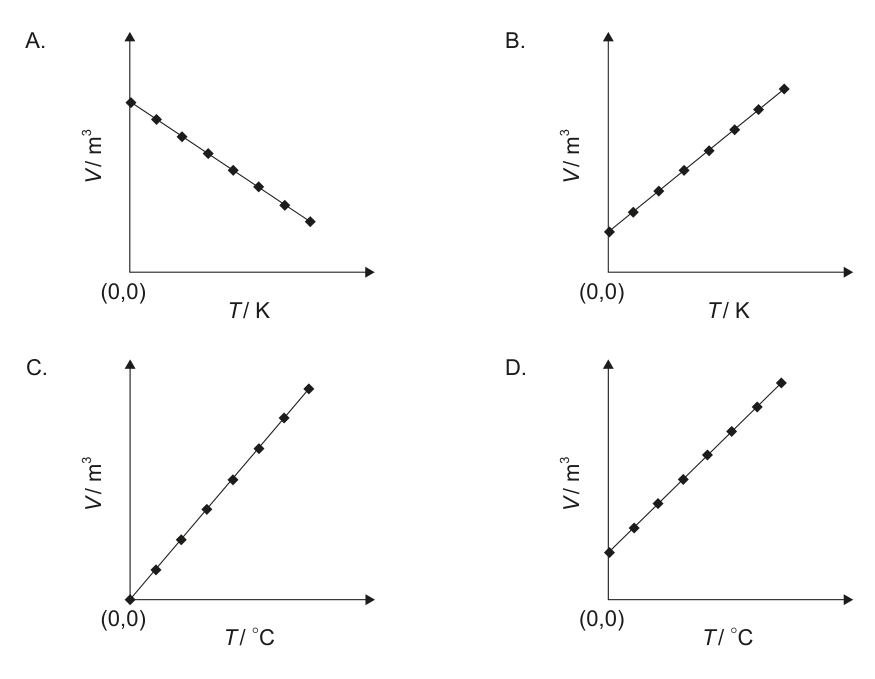
Which graph shows the correct relationship between the volume and temperature of an ideal gas at constant pressure? Combined visual options panel for Q39 (A-D).