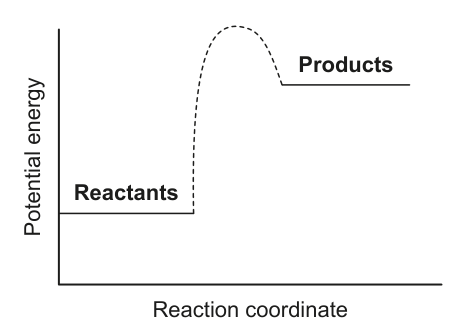
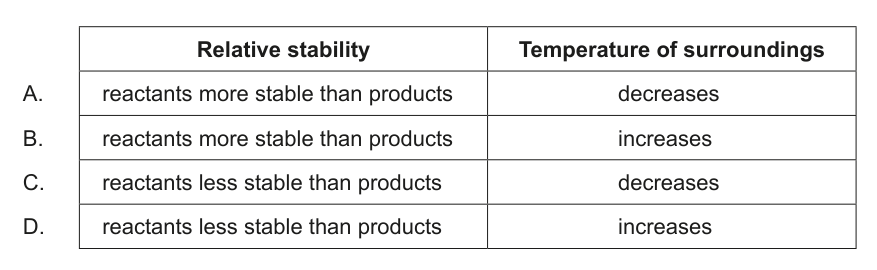
What is the correct interpretation of this energy profile?
A graph showing potential energy versus reaction coordinate, with 'Reactants' at a lower energy level than 'Products', and an activation energy barrier between them.A table with two columns: 'Relative stability' and 'Temperature of surroundings', and four rows describing different combinations of reactant/product stability and temperature changes.