A planet has a known albedo and emissivity. The average intensity received at the surface is Is.
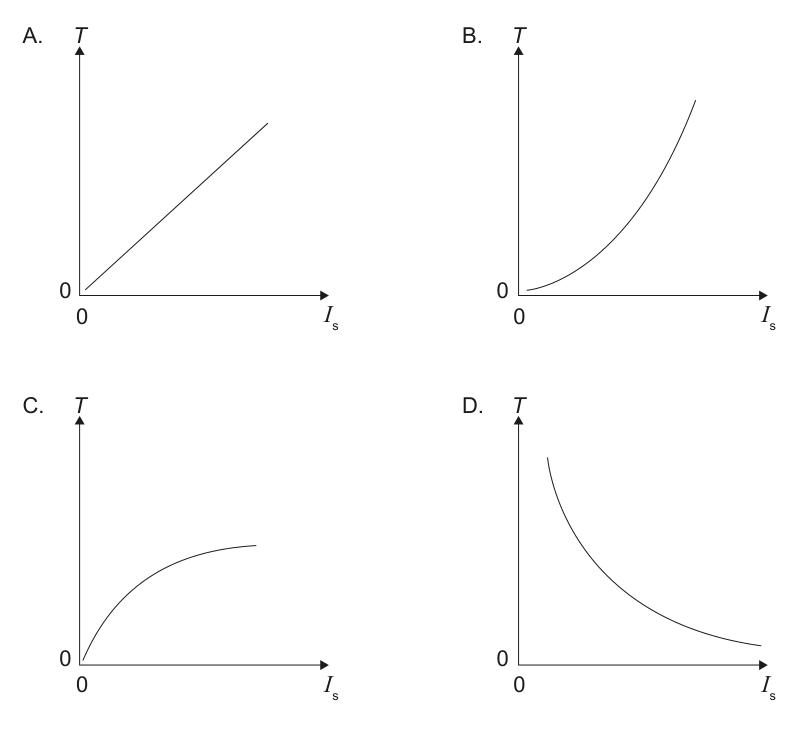
Which graph describes the variation of surface temperature T with Is?
Four graphs (A, B, C, D) showing different relationships between surface temperature T (y-axis) and intensity Is (x-axis).
Textbook topics in this question
Review the exact course sections assessed by each question part.