Question 34

From Physics HL Paper 1A (May 2025, TZ2)

  1. In two experiments X and Y measurements were made of the kinetic energies Ek of photoelectrons emitted when light is incident on two different metal surfaces.

The graph shows the variation of Ek with frequency f of the incident photons for both surfaces.
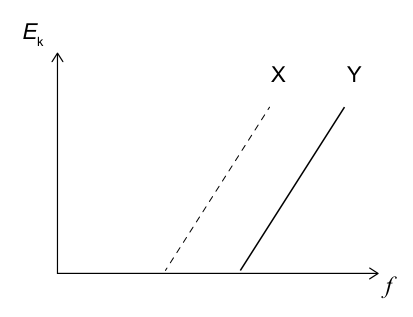
A graph showing kinetic energy (Ek) on the y-axis and frequency (f) on the x-axis, with two lines labeled X (dashed) and Y (solid) representing two different experiments.

It can be deduced that in experiment Y…

Textbook topics in this question

Review the exact course sections assessed by each question part.