Question 2

From Physics HL Paper 1B (May 2025, TZ1)

  1. A group of students is investigating refraction in a semi-circular glass block.
    Light from a ray box enters the curved side of the block. The light passes through the block and leaves, refracted, at P.

(a) Outline how the students can ensure that the light is not deflected at the curved surface. [1]

The students vary the position of the ray box to obtain data to determine the refractive index of the glass. They use a protractor to collect values for the angles of incidence θᵢ and refraction θᵣ at P and record them on a table.
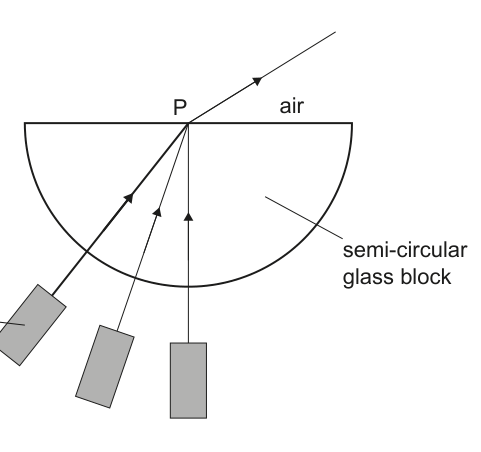
Diagram illustrating light rays from a ray box entering a semi-circular glass block, passing through it, and refracting at point P as it exits into the air. The diagram labels 'P', 'air', 'ray box', and 'semi-circular glass block'.

(Question 2 continued)
(b) (i) One of their measurements is shown. State θᵣ for this measurement. [1]
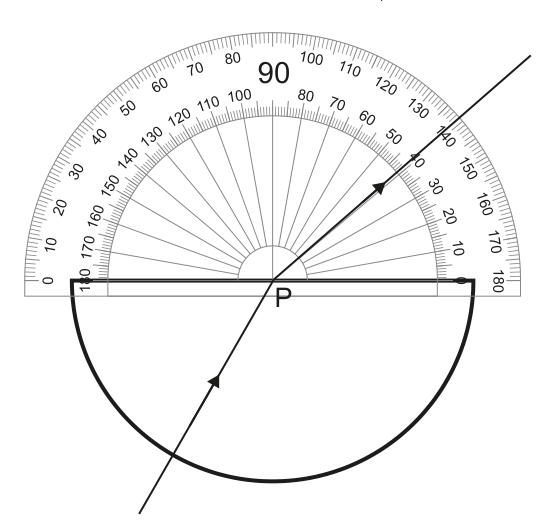
Diagram showing a protractor measuring an angle of incidence and refraction, with a ray of light passing through a semi-circular block. The question asks to state the angle of refraction (theta_r) for this measurement.

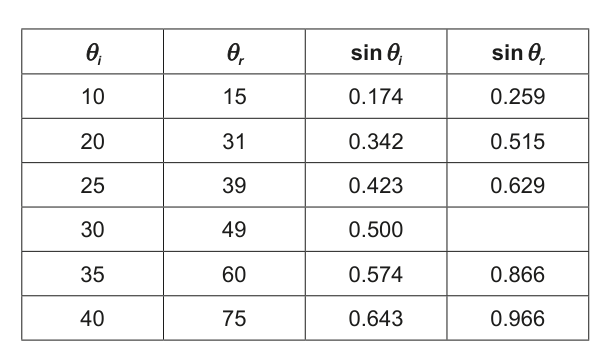
(ii) Complete the table. [1]

Table with columns for angle of incidence (theta_i), angle of refraction (theta_r), sin(theta_i), and sin(theta_r). The question asks to complete the table.
θᵢθᵣsin θᵢsin θᵣ
10150.1740.259
20310.3420.515
25390.4230.629
30490.500
35600.5740.866
40750.6430.966

(Question 2 continued)
They plot a graph of the variation with the sine of θᵢ of the sine of θᵣ.
They add uncertainty bars for sin θᵣ for the first and last data point and draw the best-fit line.
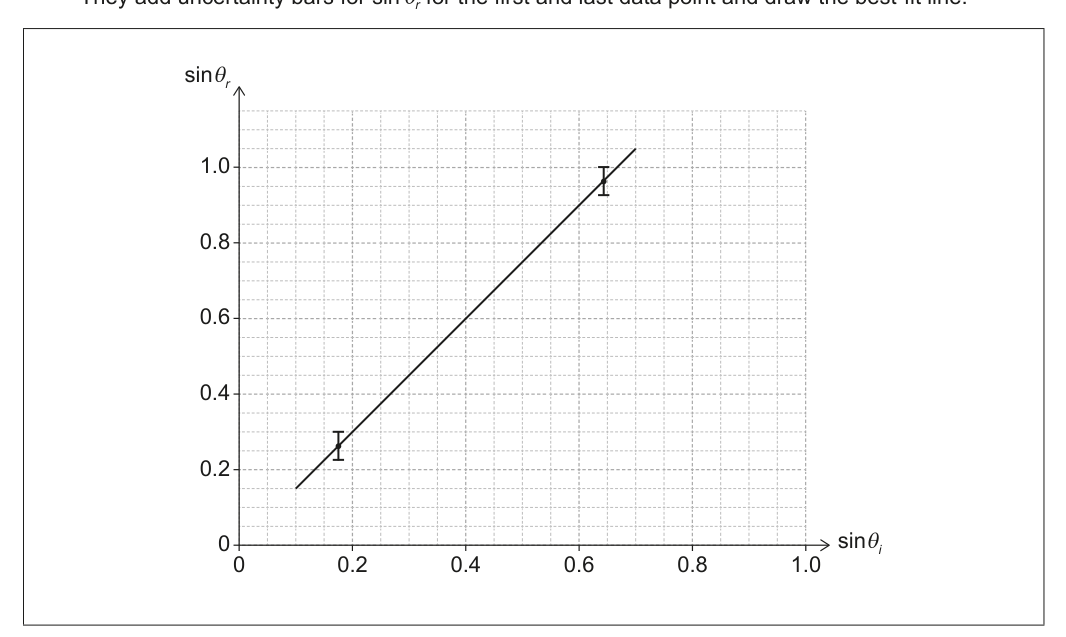
A graph plotting sin(theta_r) on the y-axis against sin(theta_i) on the x-axis, with a best-fit line drawn through data points. Uncertainty bars are shown for the first and last data points.

(c) (i) Determine the gradient of the students’ best-fit line. [2]

(ii) Draw on the students’ graph the line of maximum gradient. [1]

(iii) Determine the value of the refractive index of the glass with its absolute uncertainty. [2]

Textbook topics in this question

Review the exact course sections assessed by each question part.

Mixed-topic question
2(a)14.1 Reflection, Refraction, Wavefronts, and RaysExperimental optical alignment · legacy topic
2(c)(i)14.1 Reflection, Refraction, Wavefronts, and RaysGraph gradient analysis · legacy topic
2(c)(ii)14.1 Reflection, Refraction, Wavefronts, and RaysMaximum-gradient uncertainty line · legacy topic
2(c)(iii)14.1 Reflection, Refraction, Wavefronts, and RaysGraphical uncertainty propagation · legacy topic