- Students set up a double slit experiment to determine the wavelength λ of monochromatic light. A light source is directed at a double slit with variable separation d. An interference pattern is formed on a screen at a fixed distance from the slits. The separation of the fringes is s.
At close range the pattern is shown as a set of constructive interference fringes.
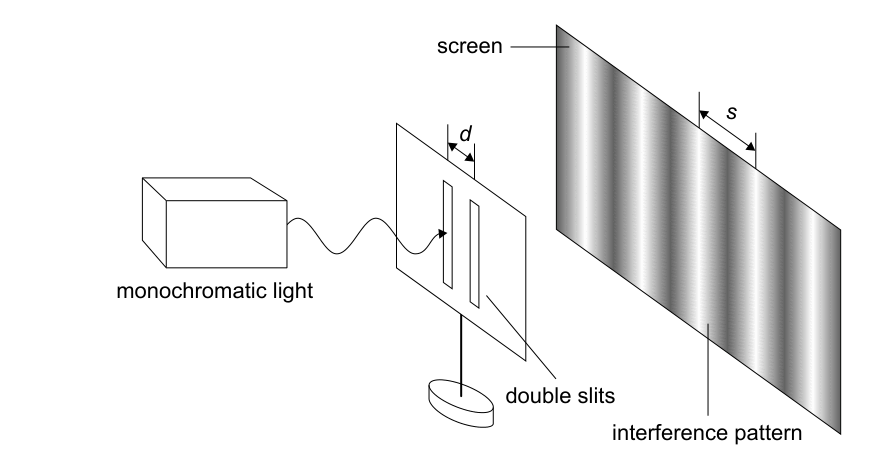
(a) Students use a ruler with millimetre intervals to measure s. Describe a method to determine s such that its absolute uncertainty is reduced. [2]
(b) Discuss the effect on the fractional uncertainty in s when using a smaller value of d. [2]
(c) (i) To determine λ students plot a graph with s on the vertical axis. State the variable that must be plotted on the horizontal axis to obtain a line of best fit that is straight. [1]
(ii) The calculator value obtained from the graph gives λ = 611.089 nm with a percentage uncertainty of ±5%. Deduce how this value should be recorded in a conclusion, including the absolute uncertainty, to the appropriate number of significant digits. [2]