- The diagram shows levels of DDT, a pesticide, in an aquatic food web in Lake Kariba, Africa. Numbers represent ppm (parts per million) of DDT in fat tissue.
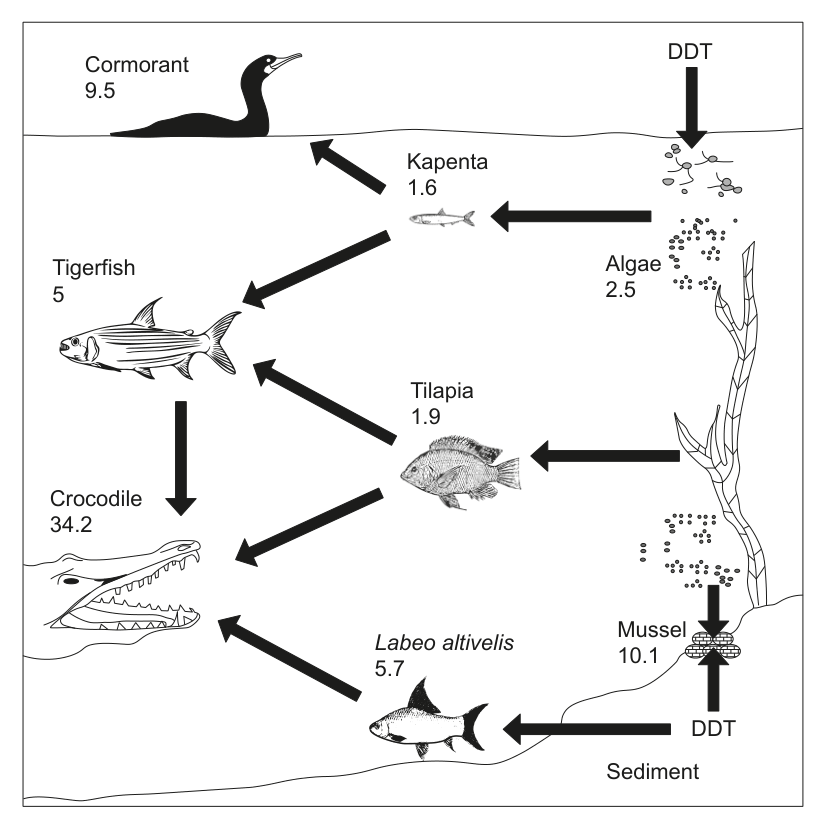
(a) Justify the observation that the crocodile has a higher mean DDT level than the cormorant or tigerfish. [2]
(b) Identify, with a reason, which fish would be the safest to consume. [2]
(c) Outline how the population size of tilapia could be estimated. [3]
(d) Discuss the impact of overfishing in Lake Kariba and how sustainable harvesting of resources can be assessed. [4]