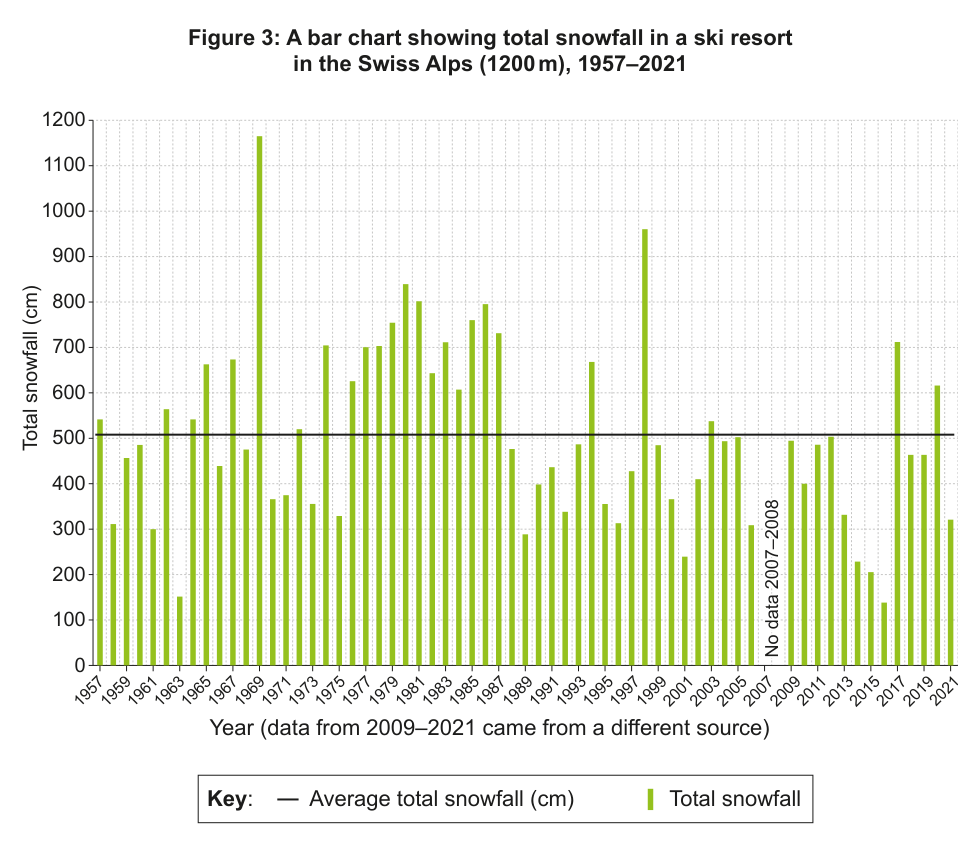
- (a) Describe the snowfall data shown in Figure 3
. [2]
(b) Outline how a reduction in snow cover in the Alps can act as a positive feedback loop for climate change. [2]
. [2]
(b) Outline how a reduction in snow cover in the Alps can act as a positive feedback loop for climate change. [2]