Question 3

From Environmental Systems SL Paper 1 (November 2024, TZ2)

  1. (a) With reference to Figure 4(a), outline how glacier retreat may impact water resources in Switzerland. [1]

(b) With reference to Figure 4(b)

Table showing the ice volume in Swiss glaciers (km³) for the years 1850, 2010, 2019, and 2100.

, calculate the percent decrease in ice volume between 1850 and 2019. [1]

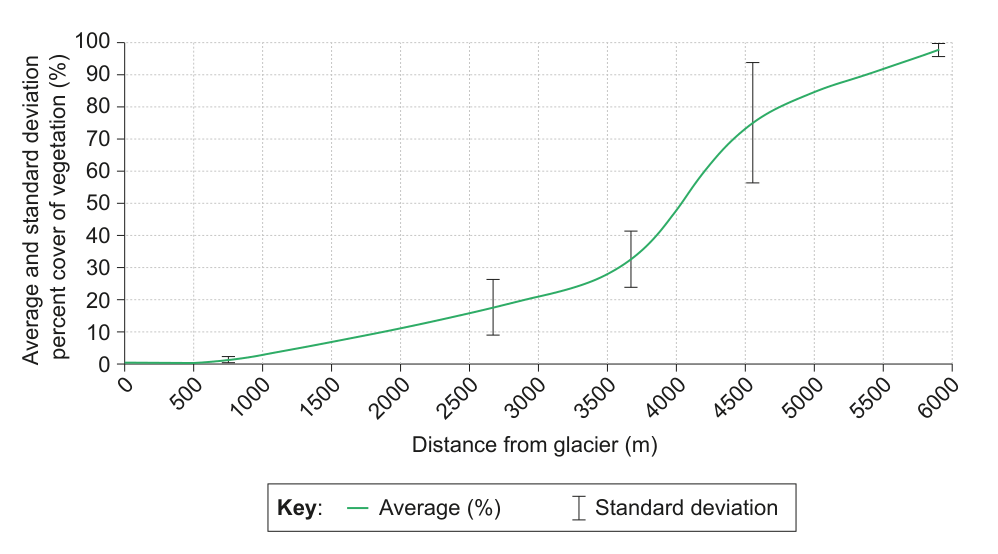
(c) Describe the processes leading to the development of a pioneer community as the glacier retreats, as shown in Figures 4(c) and 4(d)
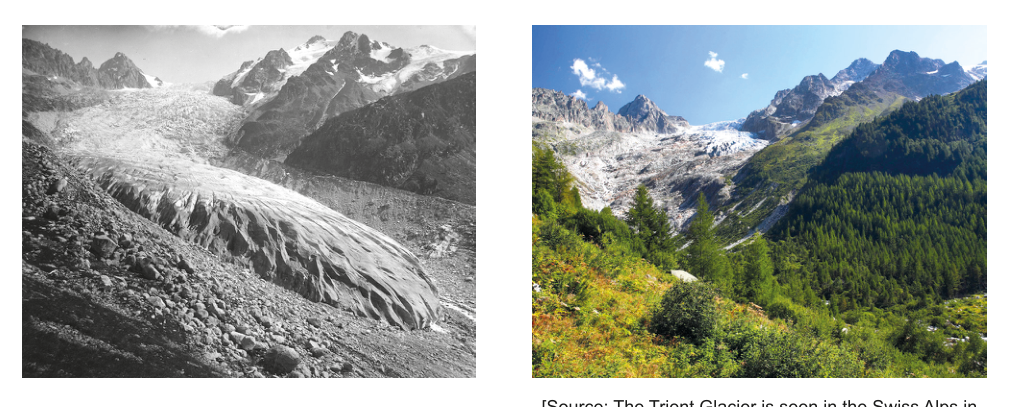
Two photos showing a glacier in the Swiss Alps, one from 1891 (left) and one from 2019 (right), illustrating glacier retreat.
Line graph showing the average percent cover of vegetation and its standard deviation as a function of distance from a glacier.

. [2]

(d) Describe a method used to collect the data on percent cover vegetation shown in Figure 4(d)

Line graph showing the average percent cover of vegetation and its standard deviation as a function of distance from a glacier.

. [3]