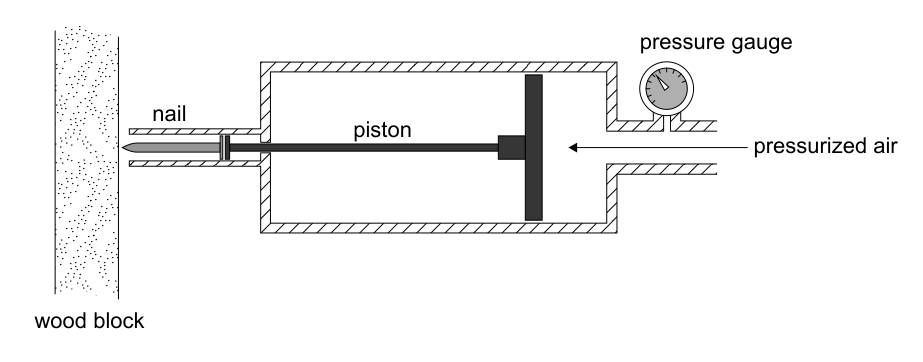
- A group of students uses pressurized air to move a piston that forces a nail into a block of wood. A gauge is used to measure the pressure P of compressed air above atmospheric pressure. The nail enters the wood perpendicular to its surface.
The students use a ruler to measure the length of the nail which remains above the surface of the wood as shown. The depth of the nail inside the wood is d. All necessary length measurements are recorded using a ruler with uncertainty ±1 mm.
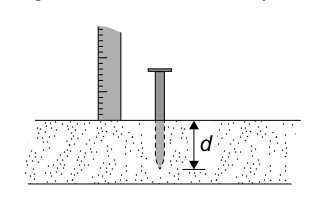
(a) Describe one consideration that must be made when placing the ruler to ensure that the length of the nail remaining above the surface of the wood is measured accurately. [1]
(b) The students systematically increase the pressure and calculate d.
| Pressure P/kPa | Nail depth in wood d/m × 10⁻³ |
|---|---|
| 50 | 15 |
| 100 | 21 |
| 150 | 26 |
| 200 | 30 |
| 250 | 33 |
| 300 | 37 |
(i) State one variable that needs to be controlled when collecting the data. [1]
(ii) Outline how the students determined the value of d. [1]
(iii) State the absolute uncertainty of d. [1]
(iv) By using two sets of data in the table, show that the relationship between d and P is not directly proportional. [2]
(c) The students suggest the following relationship between d and P:
d = k√P
where k is a constant.
To verify the relationship, the variation of d with √P is plotted.
One data point is missing.
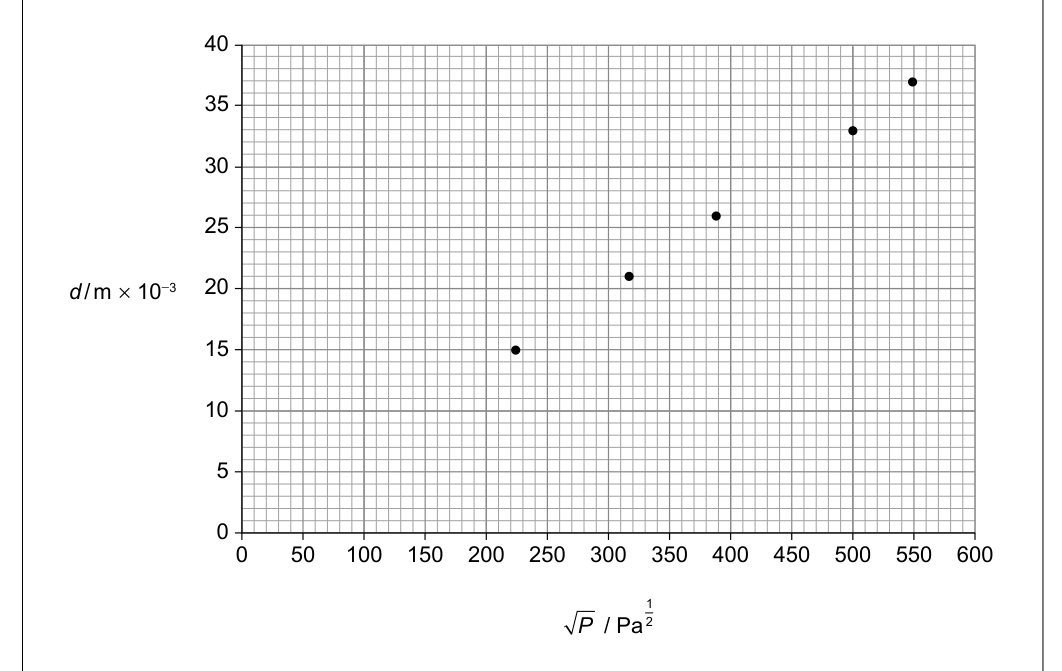
(i) Determine the coordinates of the missing point using the original data set and plot it on the graph. [1]
(ii) The percentage uncertainty in P is ±8%. Determine the uncertainty for √P when d = 33 mm and draw the uncertainty bar for this data point on the graph. [3]
(iii) The SI units of k can be expressed as kg⁻¹/² mˣ sʸ. Determine the values of x and y. [2]
(d) The students collect only one value of d for each value of P. Suggest why this is a poor method. [1]